Correlation and Your Positions

1The Arithmetic
Take a ten thousand dollar account and the one percent rule from Lesson 21. One hundred dollars of risk per trade.
A trader opens three positions. Long AUD/USD, long NZD/USD, short USD/CAD. Each is sized so a stop costs one hundred dollars.
They believe their worst case is one hundred dollars, because only one position should fail at a time.
Lesson 44 established what those three really are. All three are long commodity currencies and short the dollar. One driver moves all of them.
| What They Believe | What Is True | |
|---|---|---|
| Independent bets | Three | One |
| Worst case | $100 | $300 |
| Percent of account | 1 percent | 3 percent |
They set a one percent rule and are running three percent.
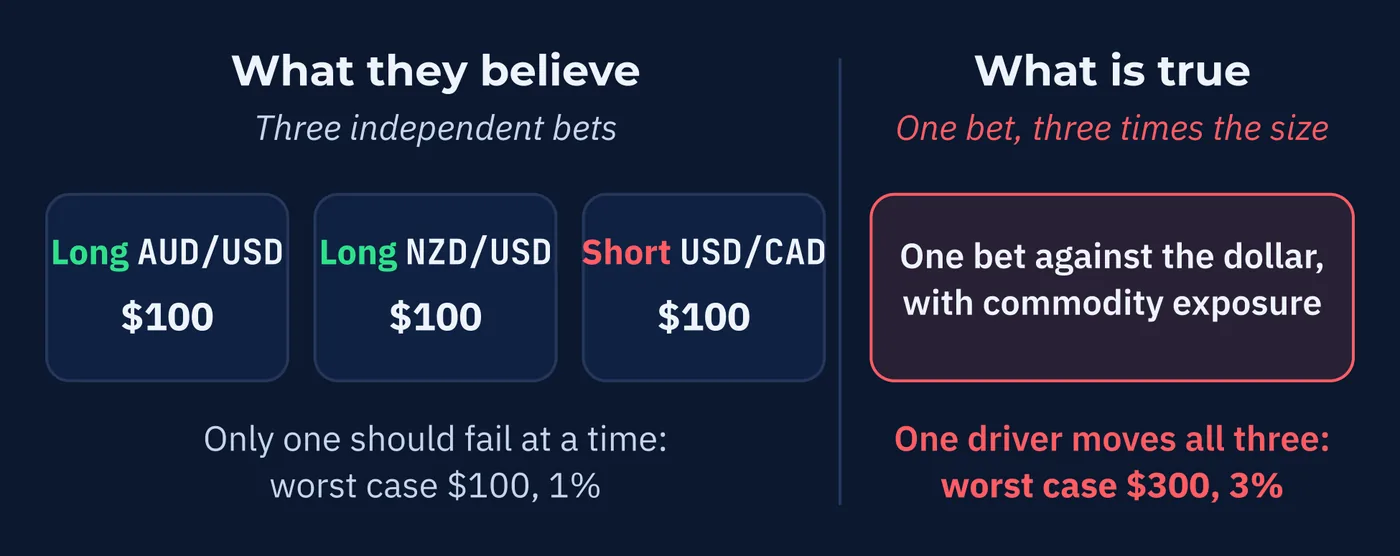
And the rule was never broken. No position was oversized. The sizing arithmetic was correct on each one. The total is still triple what they intended.
That is the problem this lesson exists to solve. It does not announce itself, because every individual number looks right.
2Why It Compounds
Lesson 21 spent time on losing streaks, because a run of losses is normal and survivable at one percent.
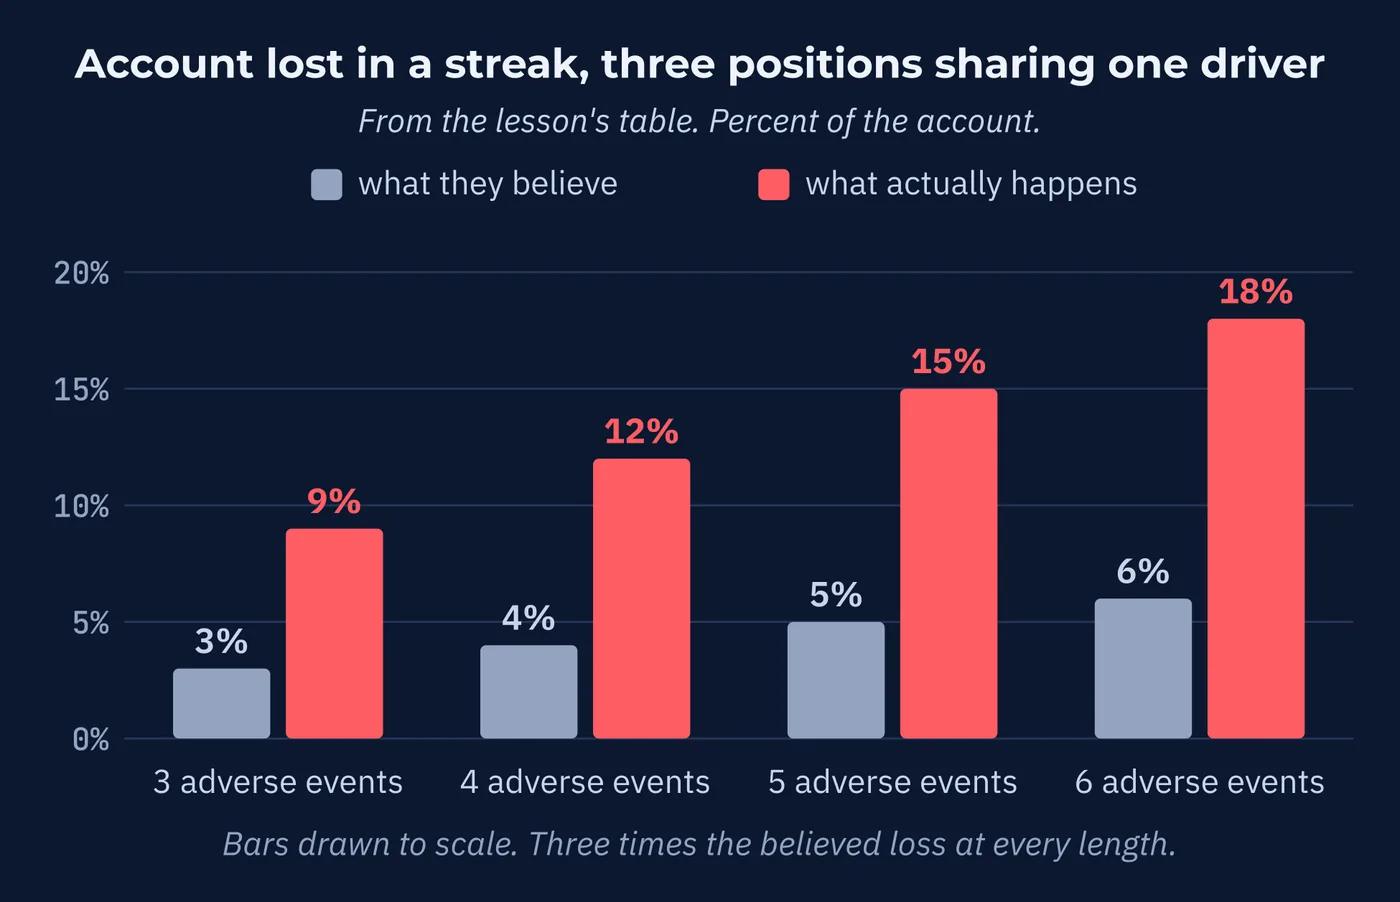
Run the same streak with the error above.
| Adverse Events | Believed Loss | Actual Loss |
|---|---|---|
| 3 | 3 percent | 9 percent |
| 4 | 4 percent | 12 percent |
| 5 | 5 percent | 15 percent |
| 6 | 6 percent | 18 percent |
The right-hand column is where accounts get into trouble. Not through one catastrophic trade, but through a rule followed carefully and measured wrongly.
Worse, Lesson 45 showed that correlations compress during stress. So the three behave as one on exactly the days the market moves hardest.
3The Exposure Audit
The fix is a habit, run before opening any position when something is already open. Three questions. About a minute, once it is familiar.
| Question | What You Are Checking |
|---|---|
| 1. What is my dollar direction? | Across everything already open, am I net long the dollar, net short, or genuinely mixed? |
| 2. What regime is this exposed to? | Would this new position benefit from calm and confident markets, or from fear? |
| 3. What does the correlation say? | Against each open position, is the figure beyond 0.50 in either direction? |
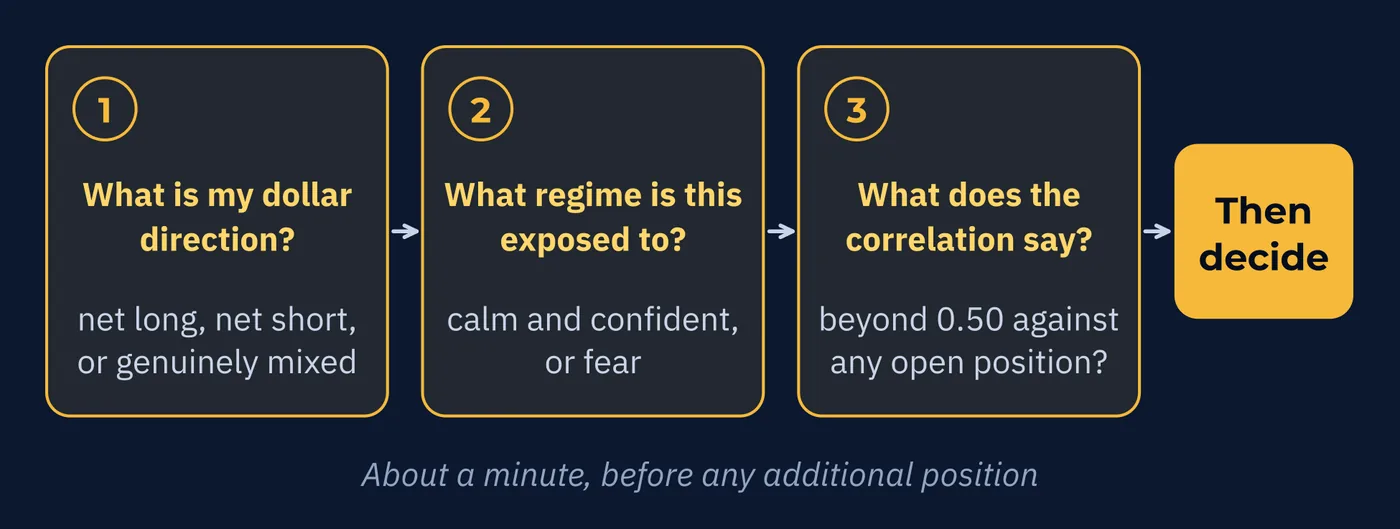
Question one catches most of it, because the dollar is in almost everything. A trader with three positions open who cannot say straight away whether they are net long or short the dollar does not know what they hold.
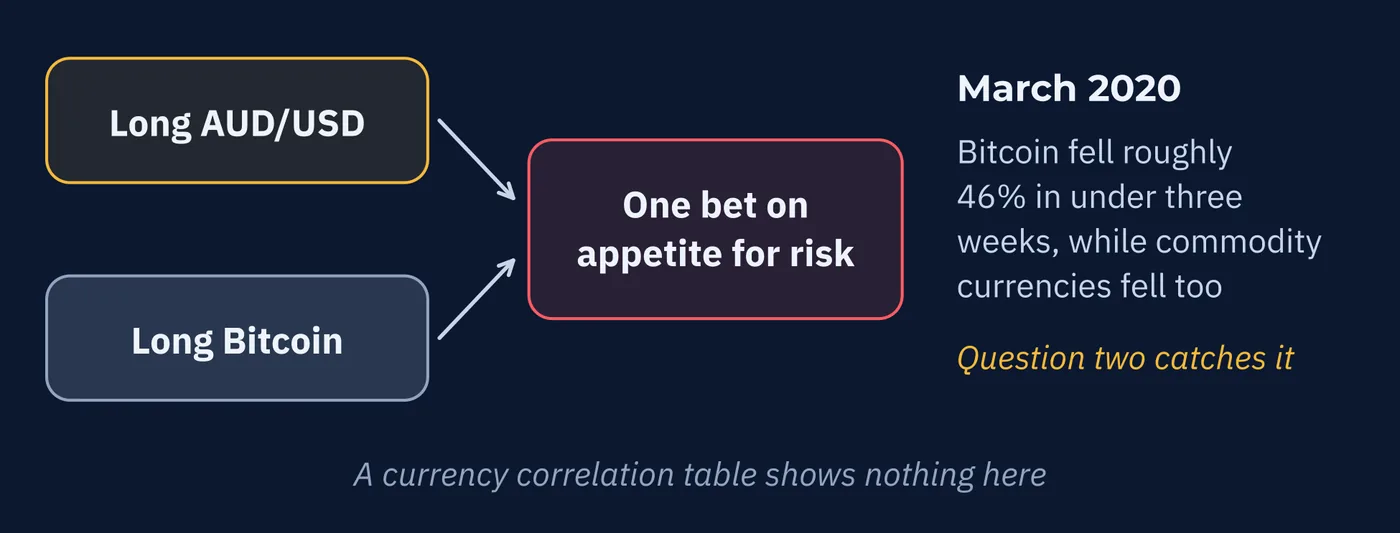
Question two catches what question one misses. Two positions can be mixed on the dollar and still be one bet on whether the world stays calm.
4Sizing in Three Tiers
Once you know two positions are related, the sizing follows a simple framework.
| Correlation | Treat Them As | On a $100 Standard Risk |
|---|---|---|
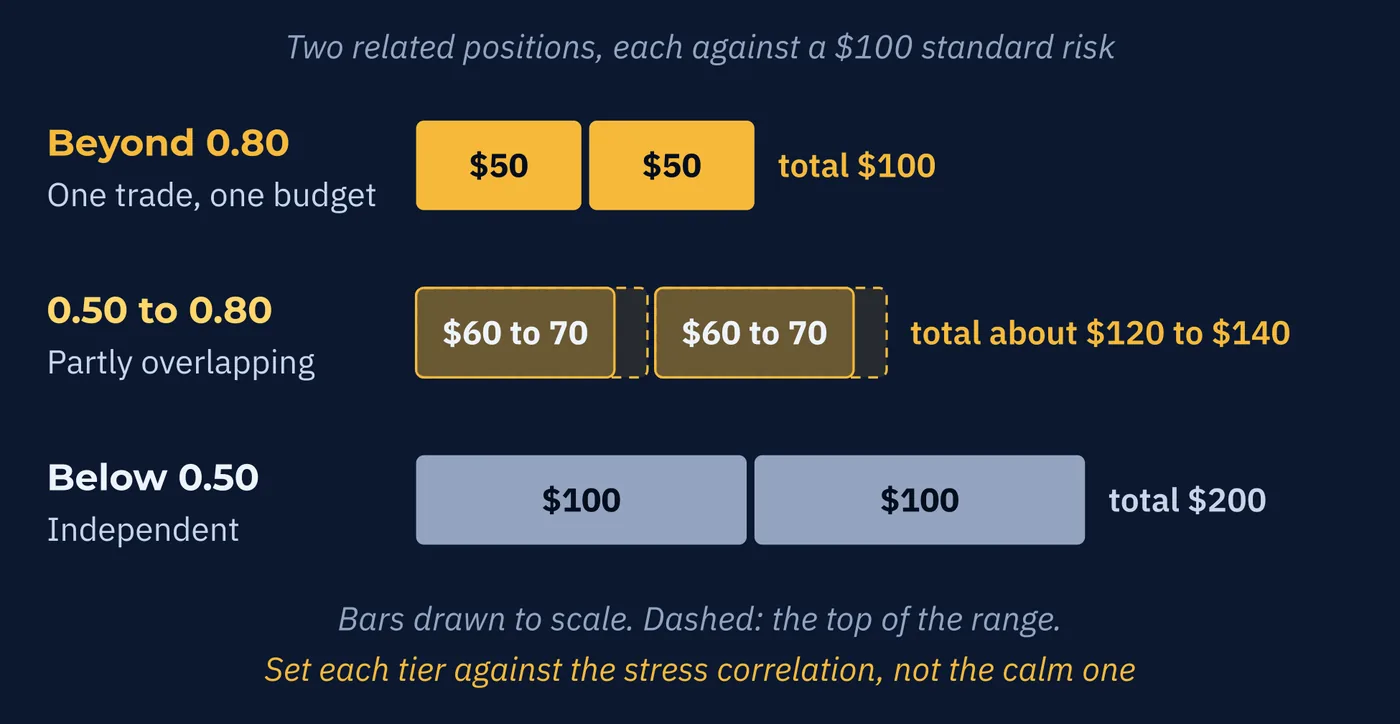
| Beyond 0.80 | One trade with one risk budget | About $50 each, totaling $100 |
| 0.50 to 0.80 | Partly overlapping | About $60 to $70 each |
| Below 0.50 | Independent | $100 each |
The top row is the important one. Two positions correlated above 0.80 are one thesis expressed twice. So the risk budget should be one allocation split between them, not two allocations.
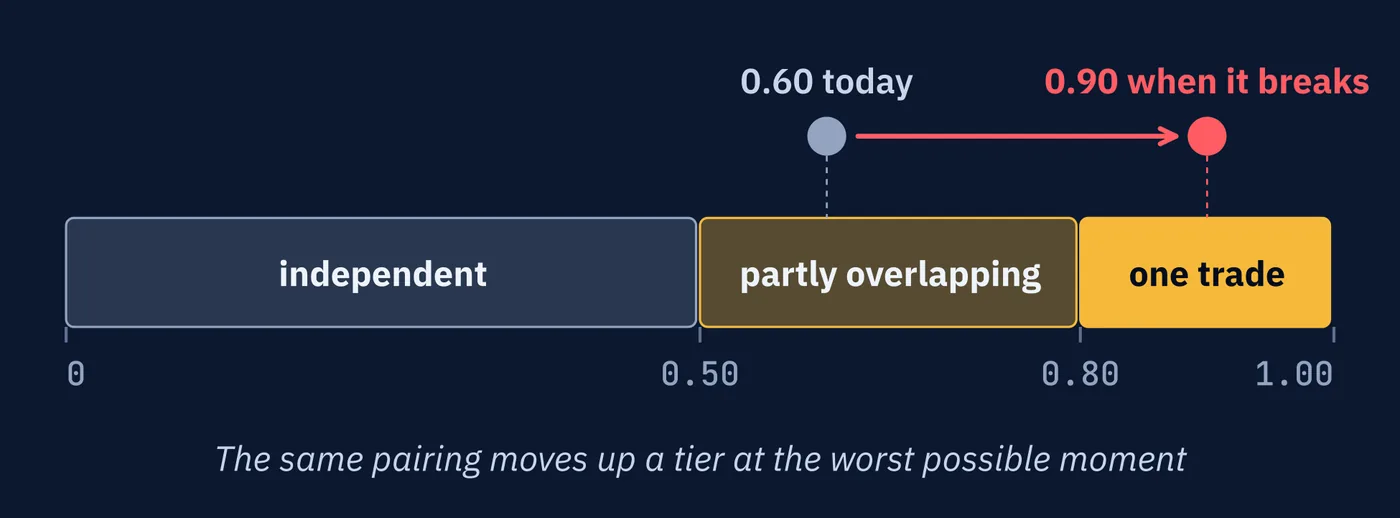
And every tier should be set against the correlation you would face under stress, not the calm figure on the screen. Lesson 45 was explicit about why. A pairing reading 0.60 today can behave like 0.90 when something breaks. That moves it up a tier at the worst possible moment.
5Sometimes It Is Fine
None of this makes correlated positions a mistake. That would be too strong, and it would rule out something experienced traders do on purpose.
There are real reasons to split one thesis across two instruments.
| The Reason | Why It Helps |
|---|---|
| Different technical structure | Each pair has its own levels, so a stop can sit where that pair's chart justifies rather than where a single position forces it |
| Different behavior in a move | One pair may run further while the other stalls, so splitting captures some of both |
The mistake is not running correlated pairs. It is running them as if they were independent.
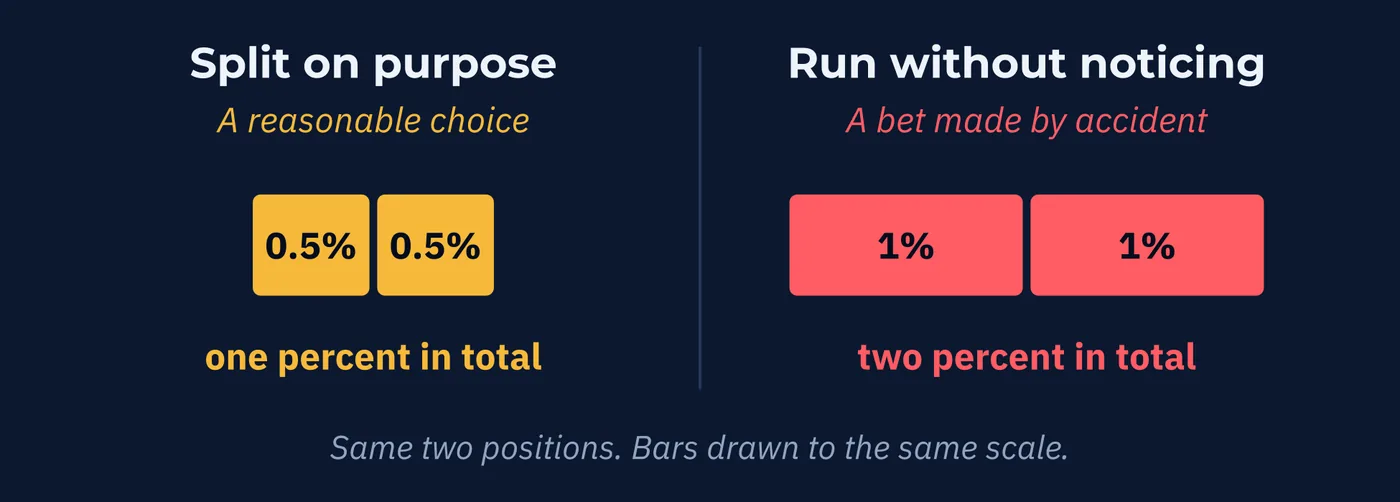
A trader who splits one percent across two correlated pairs on purpose has made a reasonable choice. A trader who runs one percent on each without noticing has made a two percent bet by accident.
Same two positions. Completely different decision.
6The Hedge That Is Not Quite a Hedge
Negative correlation raises an obvious idea. If two pairs reliably move opposite ways, holding both should cancel much of the risk.
Partly true, and the gap matters.
Lesson 45 established that correlation measures direction rather than distance. Two pairs at minus 0.90 move opposite ways on the same days. But one may travel eighty pips while the other travels forty.
opposite direction ≠ equal and opposite amountSo the offset is directional and imperfect. The mismatch is small on any single day and builds over time. Exactly the kind of leak that goes unnoticed.
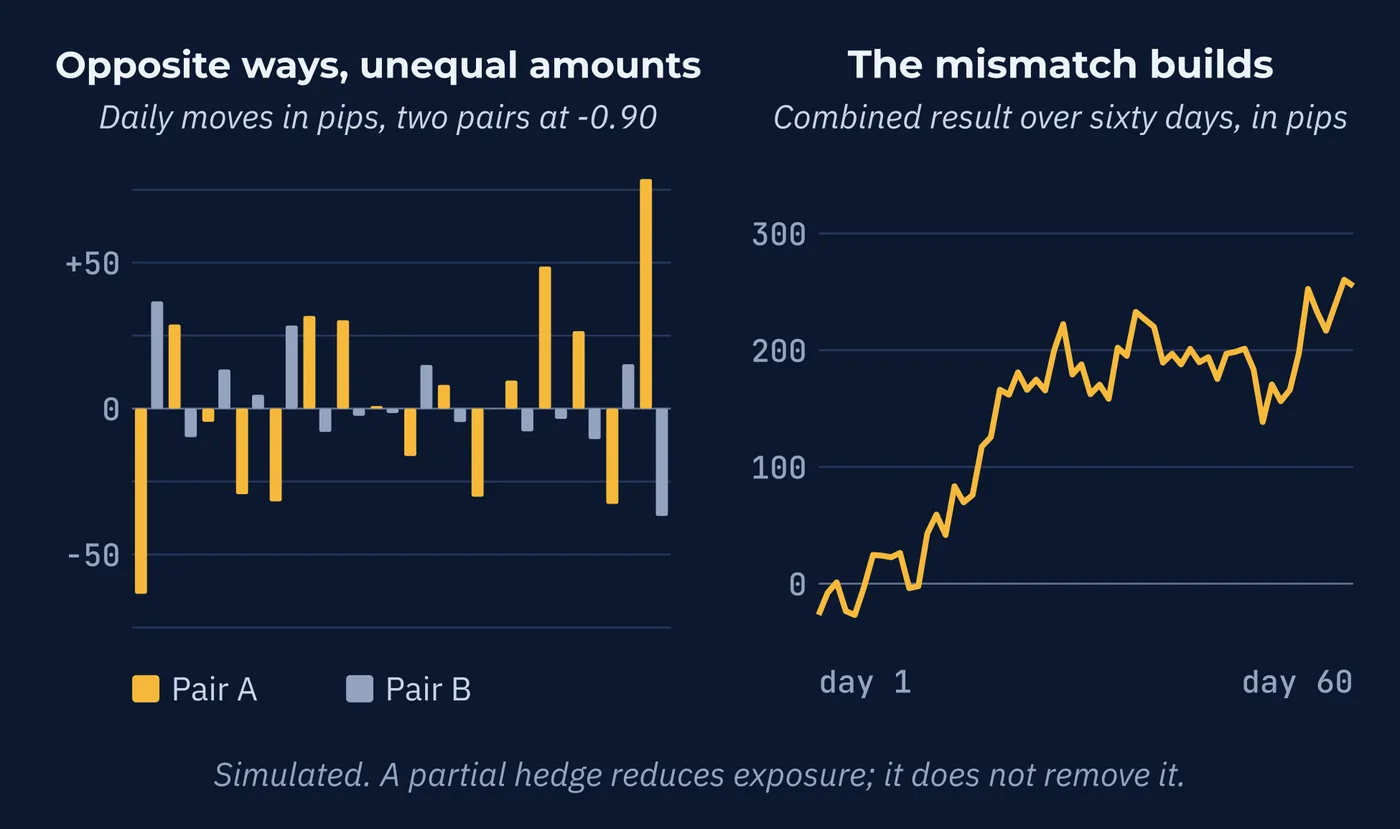
Know what a partial hedge does and does not do. It reduces exposure. It does not remove it. Treating it as though it does is how a position that felt safe produces a loss nobody budgeted for.
7Drift, and Noticing It
Correlations change while positions are open, which means an audit at entry is necessary and not sufficient.
Three habits keep it current without turning into constant fiddling.
| Habit | When |
|---|---|
| Recheck correlations on anything held across days | Weekly is enough for most holding periods |
| Watch for everything moving together at once | A broad simultaneous move is an early warning that relationships are compressing |
| Set your review threshold in advance | Before entry, as part of the plan. Not during a drawdown |
The second habit warns you earlier than the correlation table does. A rolling window describes the last sixty days. A broad simultaneous move is happening now.
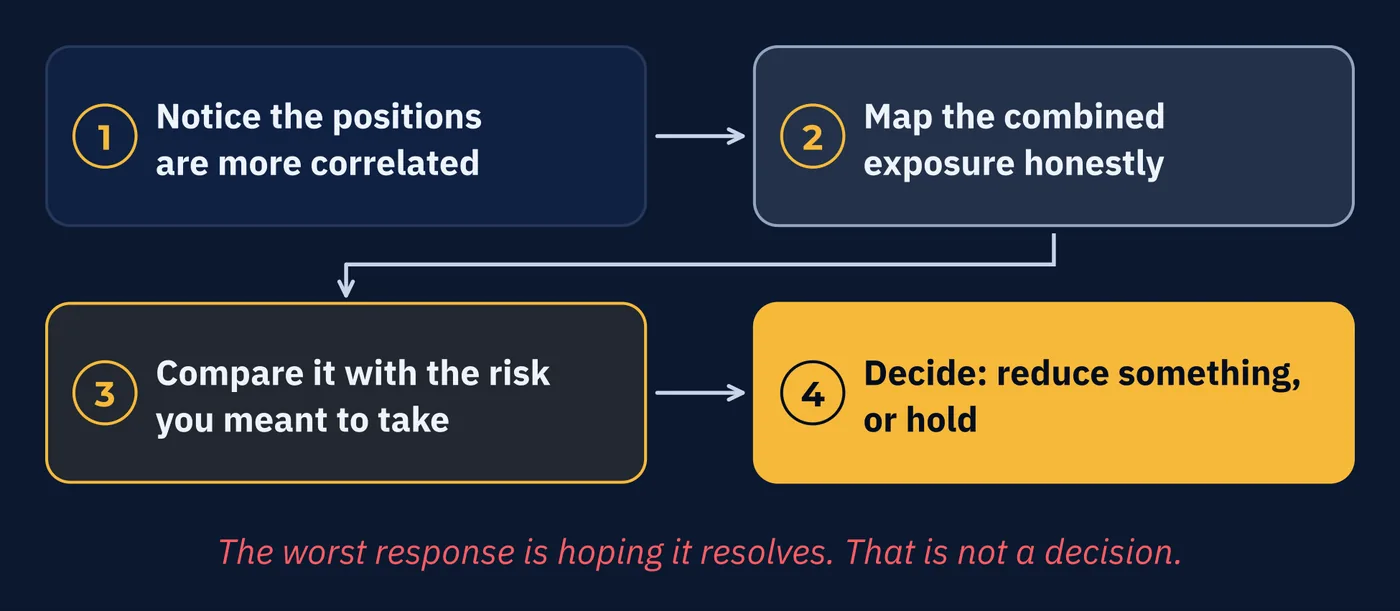
The aim is not constant reshuffling. Short-term wobble in correlation readings is normal, and reacting to all of it produces more churn than protection. The aim is to stop drift quietly building an exposure larger than the one you agreed to.
8What This Series Was For
Three lessons ago the question was why pairs move together. The answer was shared drivers, chiefly the dollar, commodity demand, and appetite for risk.
Then how to measure it. And the discovery that the number describes a past window, understates stress, and has no single correct value.
And now what it does to an account.
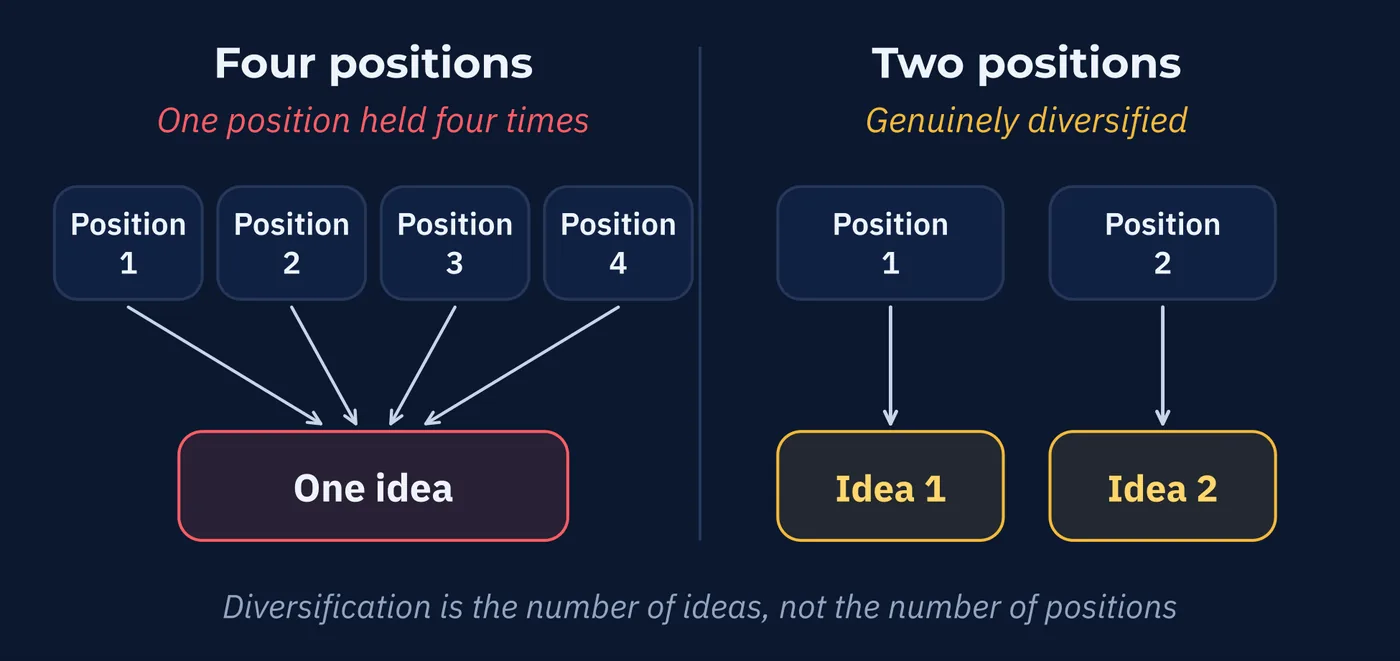
Diversification is not the number of positions. It is the number of ideas.
Four positions expressing one view are one position held four times, at four times the intended risk. Two positions expressing genuinely different views are diversified, however similar the tickers look.
Which closes a thread running back to Lesson 7. That lesson said three positions can be one bet, and moved on. Lesson 12 said it again. You now have the full account. Why it happens, how to measure it, and what to do about it.
Three Things to Remember
Try This
Twenty minutes. The first step is uncomfortable and worth doing anyway.
Words From This Lesson
| Term | What It Means |
|---|---|
| Exposure audit | A check before opening a position: dollar direction of what is open, regime sensitivity, and correlation to existing positions. |
| Combined risk budget | Treating two correlated positions as one trade and splitting a single risk allocation between them. |
| Effective risk | The real total at stake once correlation is accounted for, as opposed to the sum of individually planned risks. |
| Partial hedge | Offsetting exposure using a negatively correlated position. Reduces risk without removing it, because direction is not magnitude. |
| Correlation drift | The change in a relationship while positions are open, which can raise exposure above the level originally accepted. |
| Regime sensitivity | Whether a position benefits from confident markets or from fearful ones. |
Test Your Knowledge
Eight questions. Answer them all before checking the key on the following pages. If a question gives you trouble, the answer key tells you which section to revisit.
- A. 1 percent
- B. 3 percent
- C. 2 percent
- D. It cannot be determined
- A. Correlation tools are inaccurate
- B. Platforms hide combined exposure
- C. Each individual position was sized correctly
- D. It only occurs in exotic pairs
- A. What is my win rate
- B. What is my dollar direction across open positions
- C. Which session is most active
- D. What is the spread on the new pair
- A. Nothing, since they are different asset classes
- B. Bitcoin cannot be correlated with currencies
- C. Both are bets on the same appetite for risk
- D. The correlation tool will flag it automatically
- A. As one trade sharing a single risk budget
- B. Independently, at full risk each
- C. At double the normal size, since they confirm each other
- D. Correlation does not affect sizing
- A. Never
- B. Only with negative correlations
- C. Only during low volatility
- D. When done deliberately, with the combined risk budget adjusted
- A. Correlation measures direction, not the size of each move
- B. Negative correlations are unreliable
- C. Hedging is prohibited in currency markets
- D. The two positions cancel out entirely
- A. Close everything immediately
- B. Add a third position to offset
- C. Wait and hope the correlation falls
- D. Run the audit now, assess combined exposure, and decide deliberately
Answer Key
Each answer explains why the correct choice is correct, why the others are not, and where to reread.
Question 1 · correct answer B
If one driver moves all three, they fail together. The trader believed the worst case was one position's loss and is in fact carrying three at once.
A is what the trader believes, and it is the belief this lesson corrects. C would apply to two correlated positions rather than three. D is wrong because the arithmetic is straightforward once the shared driver is identified.
Review: Section 1, The Arithmetic
Question 2 · correct answer C
No rule was broken and no position was oversized. Each was calculated correctly, which is exactly why the total goes unnoticed.
A blames the measurement rather than the reasoning. B describes a display issue rather than the underlying problem. D is wrong because the error is most common in heavily traded majors.
Review: Section 1, The Arithmetic
Question 3 · correct answer B
The dollar appears in almost every heavily traded pair, so net dollar exposure catches most hidden concentration before anything else does.
A is a performance measure rather than an exposure check. C and D are genuine pre-trade checks from earlier lessons, but neither reveals whether positions overlap.
Review: Section 3, The Exposure Audit
Question 4 · correct answer C
AUD strengthens when confidence is high and Bitcoin amplifies whatever the risk mood is doing. Both express one view about appetite for risk.
A treats asset class labels as evidence of independence, which they are not. B is wrong because the shared regime sensitivity is well documented. D is wrong because standard tools cover currency pairs and would show nothing here.
Review: Section 3, The Exposure Audit
Question 5 · correct answer A
Above 0.80 the two are one directional thesis expressed twice, so a single risk allocation should be split between them rather than applied to each.
B is the error the lesson exists to prevent. C treats correlation as confirmation, which doubles risk rather than reducing it. D ignores that the positions will move together.
Review: Section 4, Sizing in Three Tiers
Question 6 · correct answer D
Splitting a thesis across two instruments allows stops to sit where each chart justifies, and one pair may run further than the other. The mistake is running them as if independent, not running them at all.
A is too strong and would rule out something experienced traders do deliberately. C invents a condition. B reverses it, since negatively correlated positions are a different situation entirely.
Review: Section 5, Sometimes It Is Fine
Question 7 · correct answer A
Two pairs at minus 0.90 move opposite ways on the same days, but one may travel eighty pips while the other travels forty. The offset is directional and imperfect.
B overstates it, since strong negative correlations are real and persistent. C invents a prohibition. D describes a perfect hedge, which does not exist between real pairs.
Review: Section 6, The Hedge That Is Not Quite a Hedge
Question 8 · correct answer D
It is a common situation and not a crisis. Map the combined exposure, compare it against the risk you intended, and act on it with the same clarity the entry audit would have required.
A overreacts and abandons positions that may still be sound. C is doing nothing while hoping, which Lesson 28 named as a plan replaced by a feeling. B adds exposure to a portfolio that already has too much.
Review: Section 7, Drift, and Noticing It
Keep going
How Markets Move Together is written by Kanin D. Alldredge for The Currency Classroom, and it is free to read. There is more free from CNS: start here.
Start free with CNS →