Measuring Correlation

1Putting a Number On It
Lesson 44 established that pairs move together because they share drivers. That is qualitative. It tells you a relationship exists without saying how strong.
The correlation coefficient is the measurement. A single number between minus one and plus one, describing how consistently two pairs have moved in relation to each other.
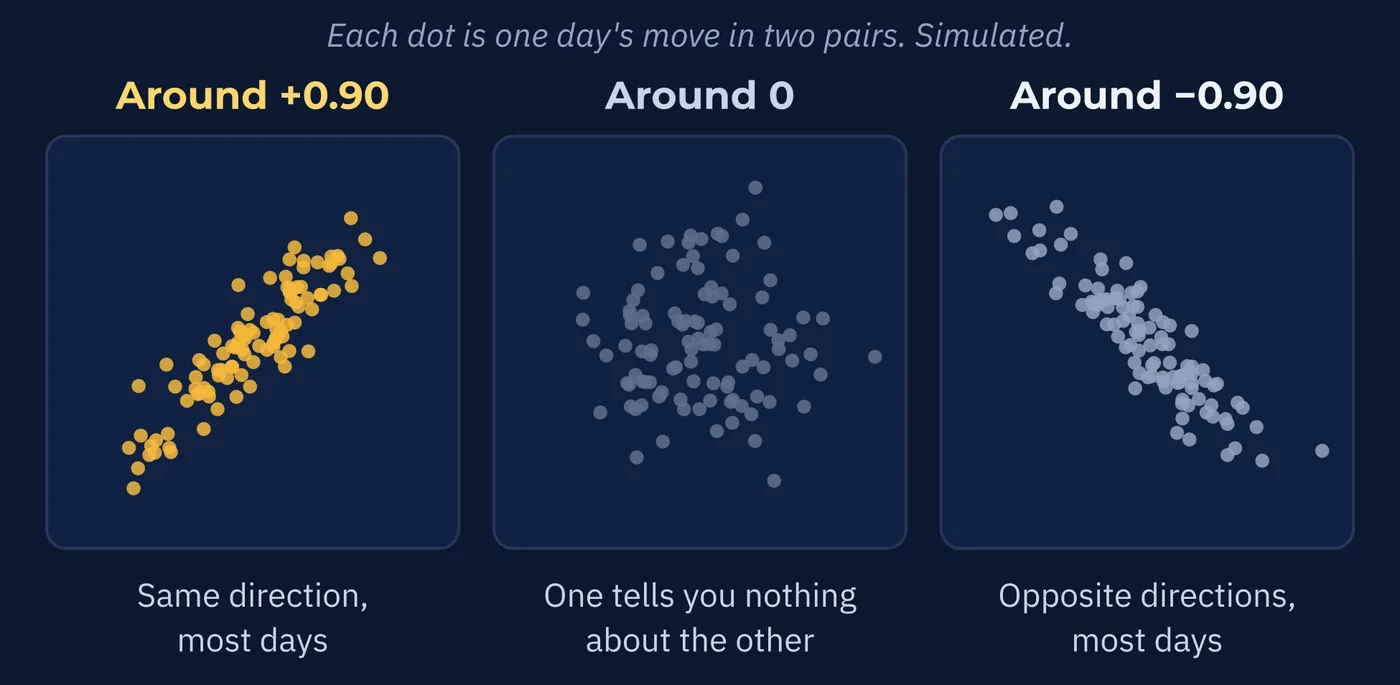
| Reading | What It Means |
|---|---|
| +1.00 | Perfect lockstep, same direction. Does not occur between real pairs. |
| Around +0.90 | Very strong. AUD/USD and NZD/USD often sit here. |
| 0.00 | No relationship. One tells you nothing about the other. |
| Around −0.90 | Very strong, opposite directions. EUR/USD and USD/CHF often sit here. |
| −1.00 | Perfect lockstep, opposite directions. Also does not occur. |
Notice both ends are theoretical. Real pairs live on the spectrum in between, and a reading of exactly plus or minus one would suggest something is wrong with the data rather than something remarkable about the market.
2The Threshold That Matters
A correlation of 0.15 exists but means very little. So where does a relationship become worth acting on?
The convention most traders and analysts use is 0.70, in either direction.
above +0.70 or below −0.70 = strong enough to matter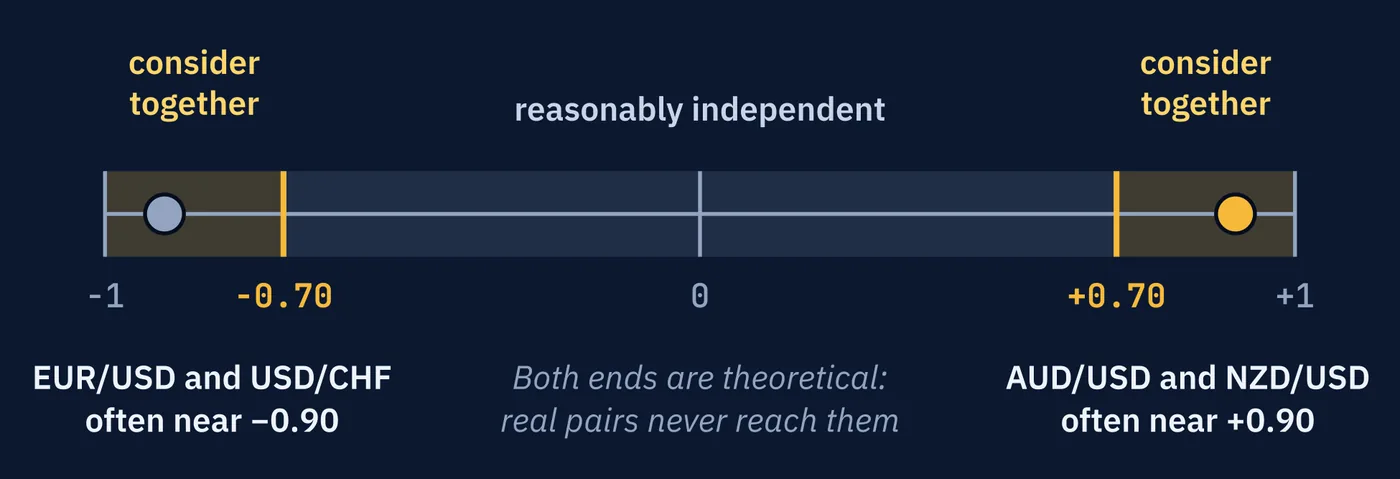
Above that, two positions should be considered together rather than separately when thinking about size and risk. Below it, the relationship exists but is weak enough that treating the pairs as reasonably independent is defensible.
The exact number is a convention rather than a law. What matters is having a line, because the alternative is a vague sense that some things are related, which no one ever acts on.
3Direction Is Not Distance
Here is the most common misreading of a correlation figure:
Correlation measures whether two pairs move the same way on the same days. It says nothing about how far each one moves.
| Two Pairs at +0.90 | On a Given Day |
|---|---|
| Both move in the same direction | Reliably, most days |
| One moves 80 pips | The other might move 40 |
| The correlation is unchanged | Because direction matched, which is all it measures |
Aligned is not identical.
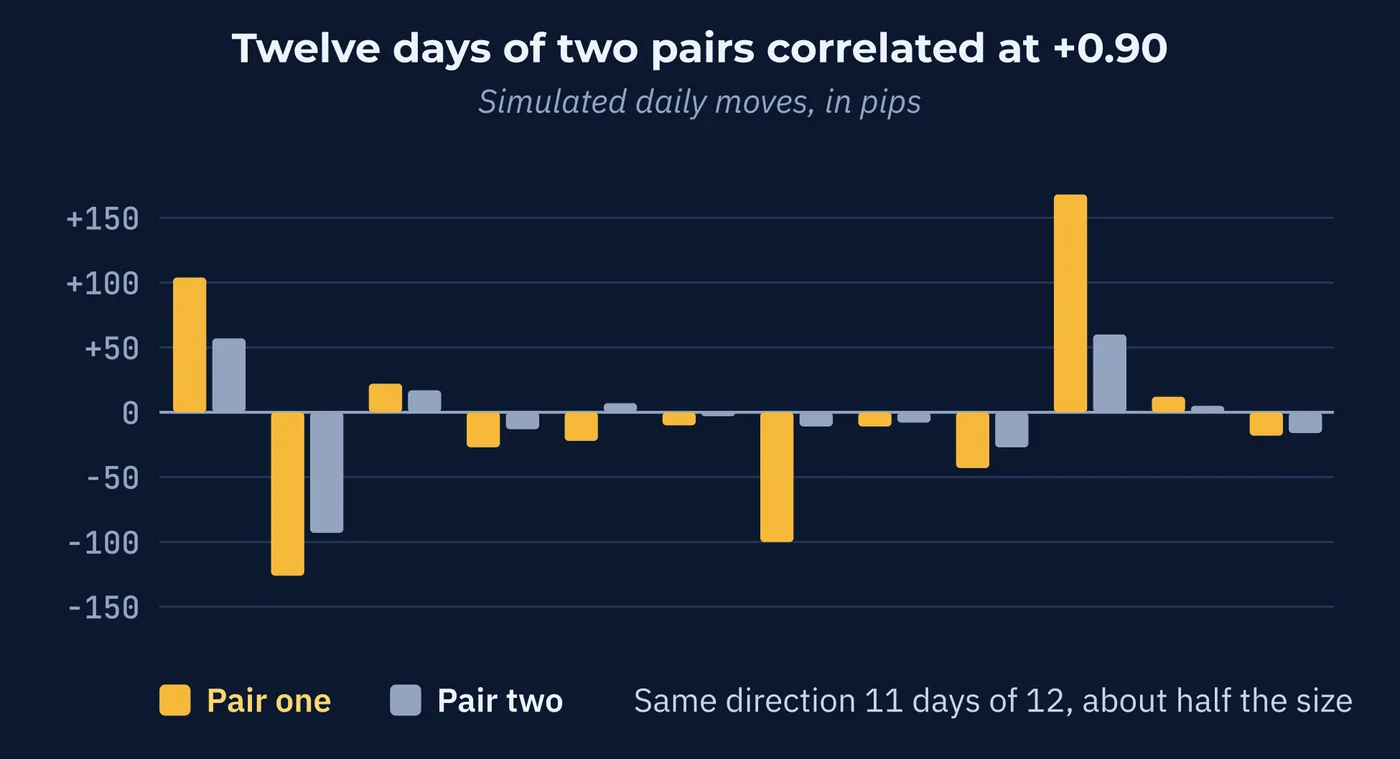
Which connects to Lesson 16. Two positions of the same lot size in two pairs correlated at +0.90 do not carry the same money risk, because the pip values differ and the typical daily ranges differ. The correlation tells you they will move together. Working out what that costs requires the pip value arithmetic.
4Several Correct Answers
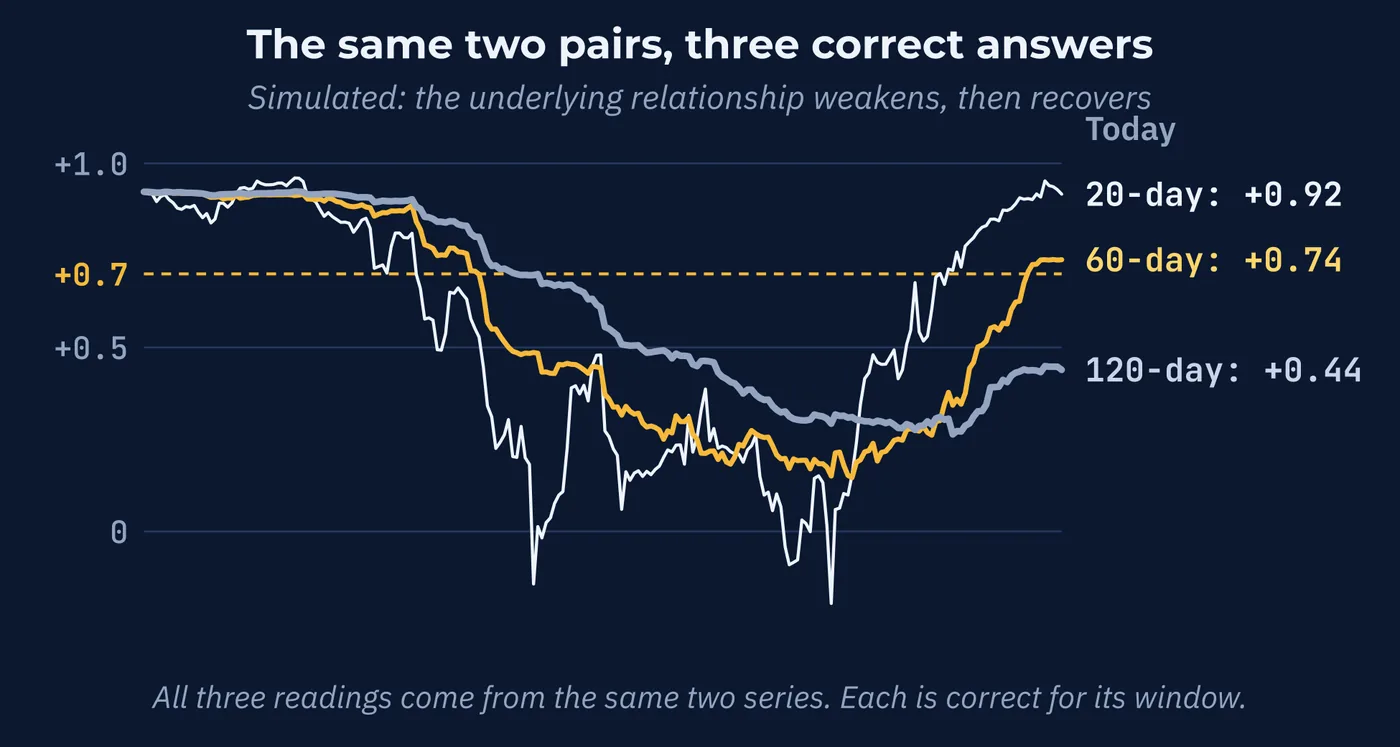
Ask what the correlation between two pairs is and the honest answer is a question in return. Over what period?
Coefficients are calculated over a rolling window of recent daily moves. Three lengths are standard.
| Window | Roughly | Behavior |
|---|---|---|
| 20 trading days | One month | Sensitive. Shifts quickly when conditions change. |
| 60 trading days | Three months | A common middle ground. |
| 120 trading days | Six months | Stable, but slow to show a change that has already happened. |
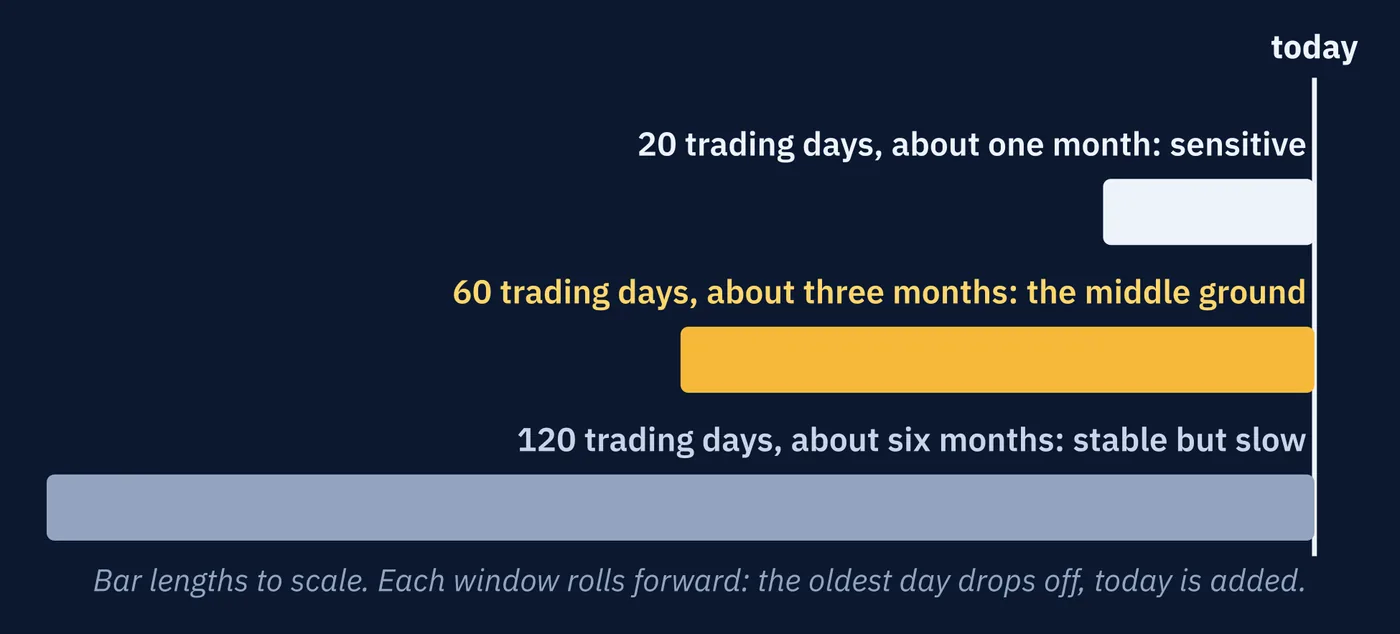
Each window rolls forward continuously. Yesterday drops off, today is added, and the number updates.
Which produces something worth stating plainly. There is no single correct correlation between two pairs. There is only a correlation measured over a stated window ending at a stated moment.
5What Moves the Relationships
Correlations shift, and three conditions do most of the shifting.
| Condition | What It Does |
|---|---|
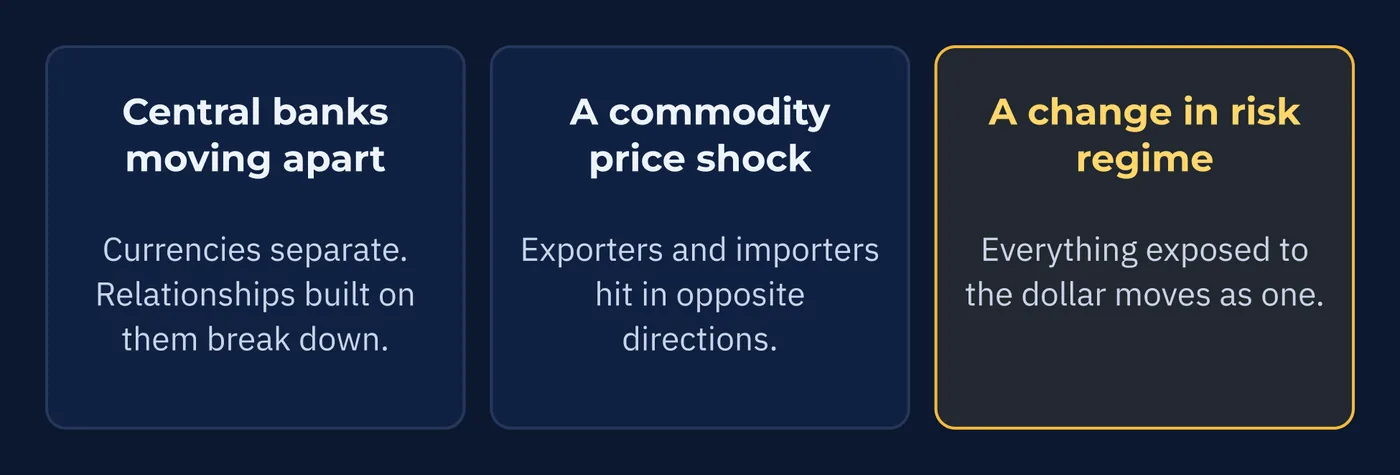
| Central banks moving apart | When one raises rates and another holds or cuts, the currencies separate. Relationships built on them moving in step break down. |
| A commodity price shock | A sharp move in oil or metals hits exporters and importers in opposite directions, so pairs that used to move together stop doing so. |
| A change in risk regime | Money moves toward safety across the board, and everything exposed to the dollar starts moving as one. |
The first two are the reasons a correlation table you looked at last quarter may already be out of date. Lesson 29 called institutional credibility the pillar that moves fastest, and a policy divergence is exactly that showing up in a relationship between two pairs.
The third is different in kind, and it deserves the rest of this lesson.
6Everything Becomes One Trade
In a serious risk-off episode, something happens that no correlation table shows in advance.
The relationships that normally distinguish pairs from each other get overwhelmed. Lesson 38 explained the mechanism, with dollar demand becoming compulsory rather than chosen when obligations come due at once.
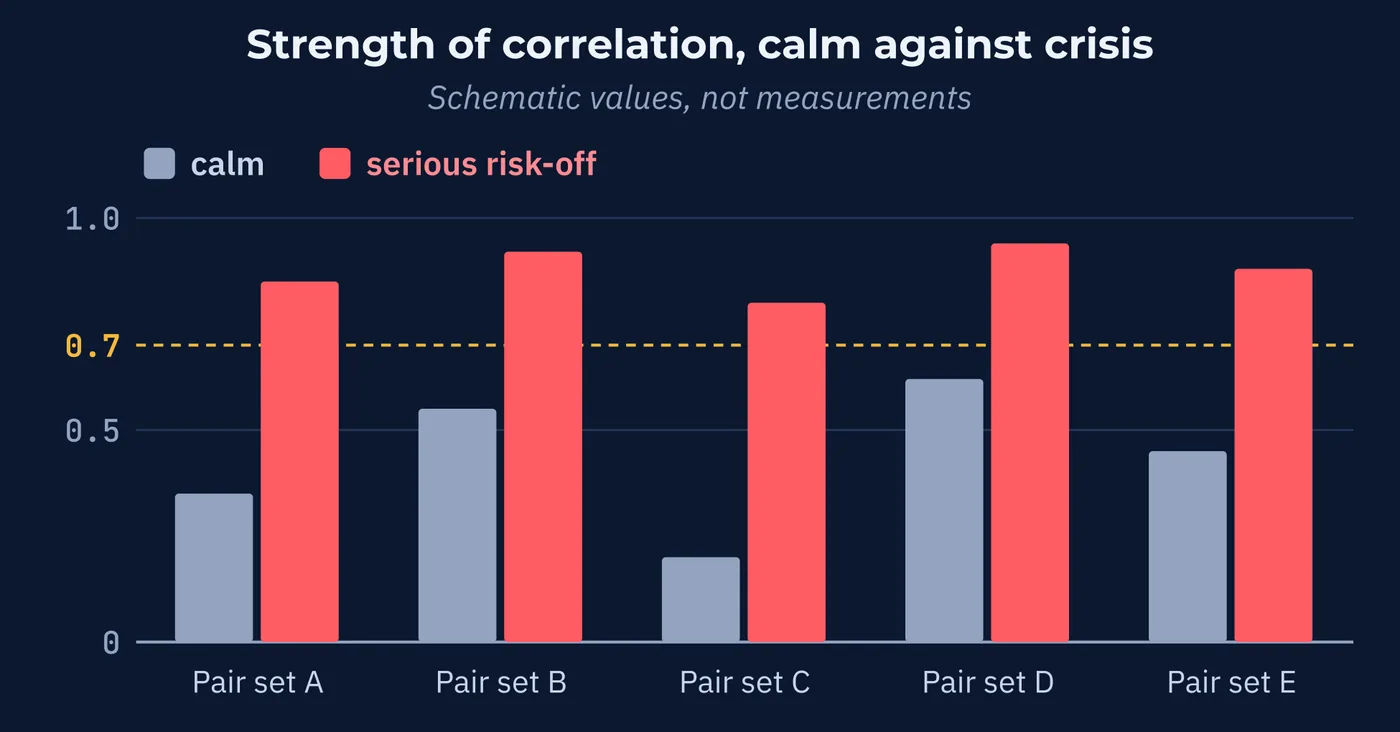
The effect on correlation is dramatic. Almost everything moves against the dollar simultaneously, and pairs that were comfortably independent start behaving as a single instrument.
Correlations do not drift during a crisis. They compress toward their extremes.
The March 2020 episode showed the pattern in two distinct phases. First an acute scramble for dollars, in which the safe haven function overwhelmed everything else. Then a reset once central banks responded at scale, with different relationships emerging on the other side.
Which is worth noticing. The nature of the event determines which safe haven dominates, so even the crisis pattern is not identical every time.
7The Number You Read Is the Wrong One
Put Sections 4 and 6 together and an uncomfortable conclusion follows.
You look up a correlation during a calm period, because that is when people plan. The number reflects a calm period, because that is what the window contained.
Then a stress event arrives and the actual correlation is much higher than the number you planned with.
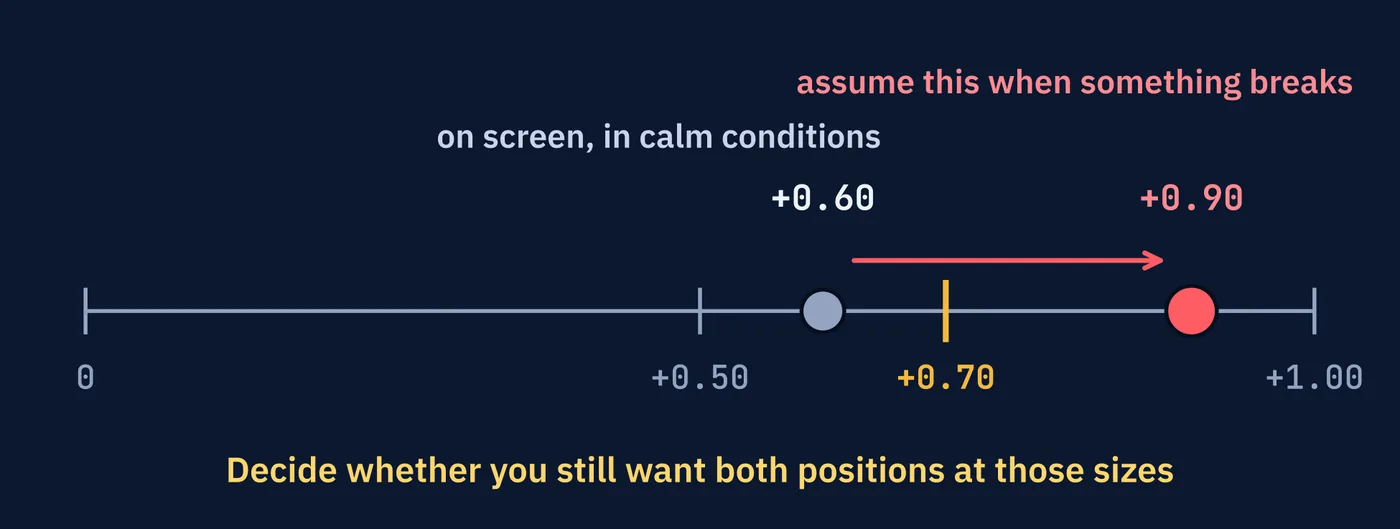
That single adjustment converts correlation from an interesting statistic into a risk control.
8Where the Number Comes From
You do not need to calculate any of this yourself. CurrencyNewsSource.com has a free correlation table that shows how the major currency pairs have been moving in relation to one another over the measured period.
Find the two pairs you want to compare, read the number where they meet, and note the window alongside it.
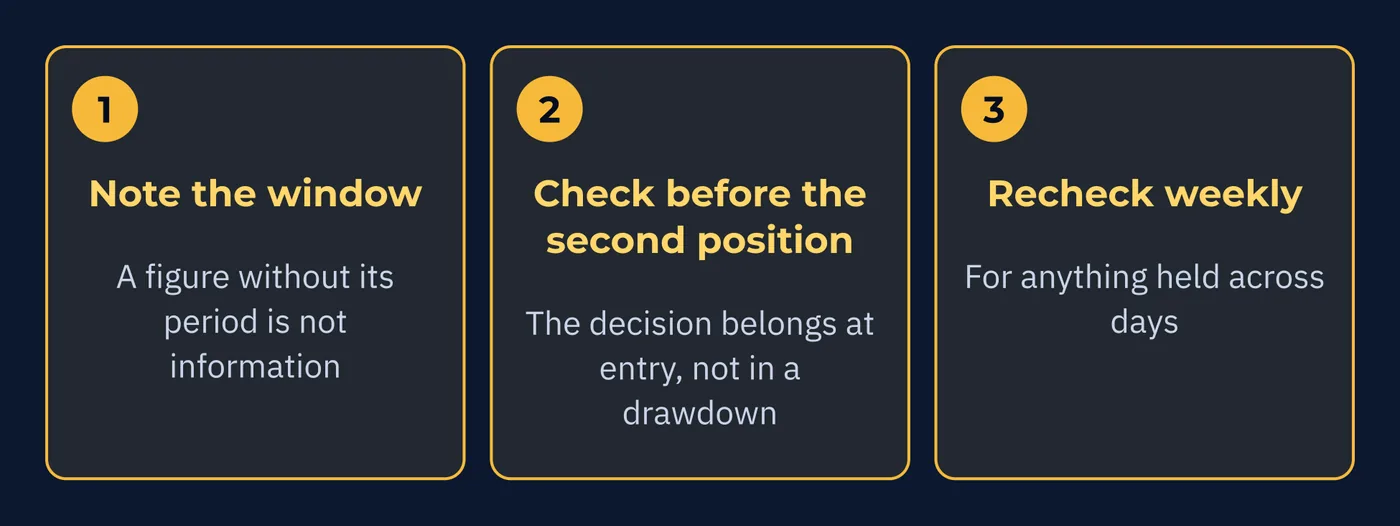
Three habits make that number useful rather than decorative.
| Habit | Why |
|---|---|
| Always note the window alongside the number | A figure without its period is not information |
| Check before opening a second position, not after | The decision you want to make is at entry, not during a drawdown |
| Recheck weekly for anything held across days | Relationships drift, and Lesson 46 shows what that does to exposure |
One more caution about the tools themselves. Different sources may show slightly different figures for the same pairing, because they use different window lengths, different price sources, and different update times. Lesson 40 explained why there is no single official price, and the same reasoning applies here.
So treat a correlation reading as an approximate description rather than a precise fact. It is measuring a tendency in the recent past, from data that is itself derived.
The next lesson takes all of this and applies it to the thing that actually matters. What happens to your account when three positions turn out to be one.
Three Things to Remember
Try This
Twenty minutes. One correlation tool and an honest comparison.
Words From This Lesson
| Term | What It Means |
|---|---|
| Correlation coefficient | A number between minus one and plus one measuring how consistently two pairs have moved in relation to each other. |
| Positive correlation | Pairs tending to move in the same direction. |
| Negative correlation | Pairs tending to move in opposite directions. |
| Rolling window | The recent period a correlation is calculated over. Typically 20, 60, or 120 trading days. |
| Correlation drift | The gradual change in a relationship while positions are open. |
| Correlation compression | The tendency of relationships to move toward their extremes during market stress. |
| Risk regime | The prevailing appetite for risk across markets. A change in it reshapes correlations broadly. |
Test Your Knowledge
Eight questions. Answer them all before checking the key on the following pages. If a question gives you trouble, the answer key tells you which section to revisit.
- A. 0 to 100
- B. 0.00 to 1.00
- C. −1.00 to +1.00
- D. −100 to +100
- A. The pairs move in opposite directions
- B. The data is unreliable
- C. The pairs move in lockstep
- D. No meaningful directional relationship
- A. ±0.30
- B. ±0.70
- C. ±0.50
- D. ±0.95
- A. They move the same direction on the same days, but possibly different distances
- B. They move the same distance on the same days
- C. One causes the other to move
- D. They will continue correlating at +0.90
- A. A single fixed number for each pairing
- B. The average of all window lengths
- C. Whatever the 120-day window shows
- D. There is none. Only a correlation over a stated window at a stated moment
- A. Changes in trading session hours
- B. Spread widening at rollover
- C. Central banks moving in different policy directions
- D. Changes in lot size conventions
- A. They break down and become random
- B. They compress toward their extremes, and pairs behave as one
- C. They remain stable
- D. They invert entirely
- A. For the correlation likely during a stress event
- B. For the correlation currently displayed
- C. For the average across all windows
- D. Correlation should not affect sizing
Answer Key
Each answer explains why the correct choice is correct, why the others are not, and where to reread.
Question 1 · correct answer C
The scale runs from minus one, meaning perfectly opposite movement, through zero, meaning no relationship, to plus one, meaning perfectly aligned movement.
A and D invent scales that are not used. B excludes negative correlation entirely, which would remove half the useful information.
Review: Section 1, Putting a Number On It
Question 2 · correct answer D
A reading near zero means knowing what one pair is doing tells you nothing useful about the other.
A describes a negative reading. C describes a reading near plus or minus one. B confuses a genuine result with a data problem.
Review: Section 1, Putting a Number On It
Question 3 · correct answer B
Beyond 0.70 in either direction, two positions should be considered together rather than separately when thinking about size and risk.
A and C describe relationships too weak to require combined treatment. D is so strict it would exclude most relationships that genuinely matter.
Review: Section 2, The Threshold That Matters
Question 4 · correct answer A
Correlation measures directional consistency, not size. One pair might move 80 pips while the other moves 40, and the correlation is unaffected.
B is the common misreading this section exists to correct. C assumes causation, which Lesson 44 disproved. D treats a description of the past as a forecast.
Review: Section 3, Direction Is Not Distance
Question 5 · correct answer D
Coefficients are calculated over rolling windows that update continuously. The same pairing can read plus 0.67 and plus 0.91 at different times, and both are accurate.
A assumes a permanence the measure does not have. C picks one window arbitrarily. B averages figures that describe different periods, which produces something describing none of them.
Review: Section 4, Several Correct Answers
Question 6 · correct answer C
When one central bank raises rates while another holds or cuts, the currencies separate and relationships built on them moving in step break down.
A affects liquidity and volatility rather than the relationships between pairs. B is a cost effect. D is an administrative convention with no bearing on correlation.
Review: Section 5, What Moves the Relationships
Question 7 · correct answer B
Dollar demand becomes compulsory, almost everything moves against the dollar at once, and pairs that were independent start behaving as a single instrument.
A describes randomness, when the opposite happens and relationships strengthen. C is contradicted by every documented stress episode. D would mean positive relationships turning negative, which is not what occurs.
Review: Section 6, Everything Becomes One Trade
Question 8 · correct answer A
Calm-market correlations systematically understate what materializes under stress, because the measurable periods are mostly calm and the damaging ones are not.
B uses the figure that will be too low exactly when it matters. C averages across periods rather than planning for the worst. D ignores the risk that two positions become one.
Review: Section 7, The Number You Read Is the Wrong One
Keep going
How Markets Move Together is written by Kanin D. Alldredge for The Currency Classroom, and it is free to read. There is more free from CNS: start here.
Start free with CNS →