Who You Are Trading Against

Nobody Is Hunting You. Something Else Is Happening.
1The Question
Almost every trader arrives at the same suspicion eventually.
You place a position with a stop below a level that looks safe. Price dips just far enough to take you out. Then it turns and goes where you thought it would.
It happens often enough that it stops feeling like coincidence.
The usual conclusion is that somebody saw your order. That is wrong. The real explanation is more interesting, and far more useful.
2The Problem Every Large Participant Has
Start with liquidity, which here means the ability to buy or sell a large amount without the act of transacting moving the price against you.
For a micro lot, liquidity is effectively unlimited. Your order is too small to matter to anything.
For a participant buying hundreds of millions, it is the central constraint of the job.
| If They Buy | What Happens |
|---|---|
| All at once, aggressively | Their own buying pushes the price up before the order is filled |
| Gradually, into available supply | They get a reasonable average price, but it takes time |
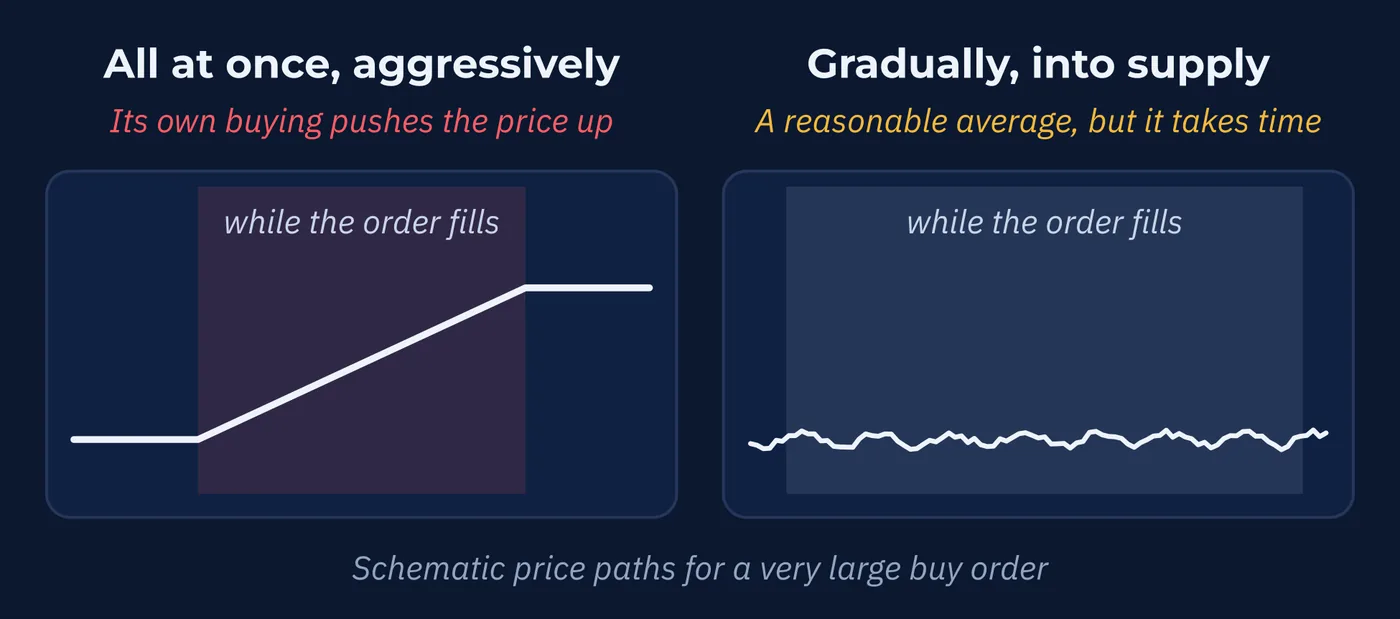
So a large buyer needs sellers. Not in a figurative sense. They need real orders on the other side, in volume, at a price they will pay.
Finding counterparties is the whole job. Everything else follows from it.
3Where the Sellers Are
So where does a large buyer find a concentration of sell orders?
Think about where stop losses go. Lesson 3 mentioned reading levels on a chart, and everybody reads roughly the same ones. Below the obvious support. Under the recent swing low. At the round number.
So stops are not spread evenly across the price range. They pile up in the same few places.
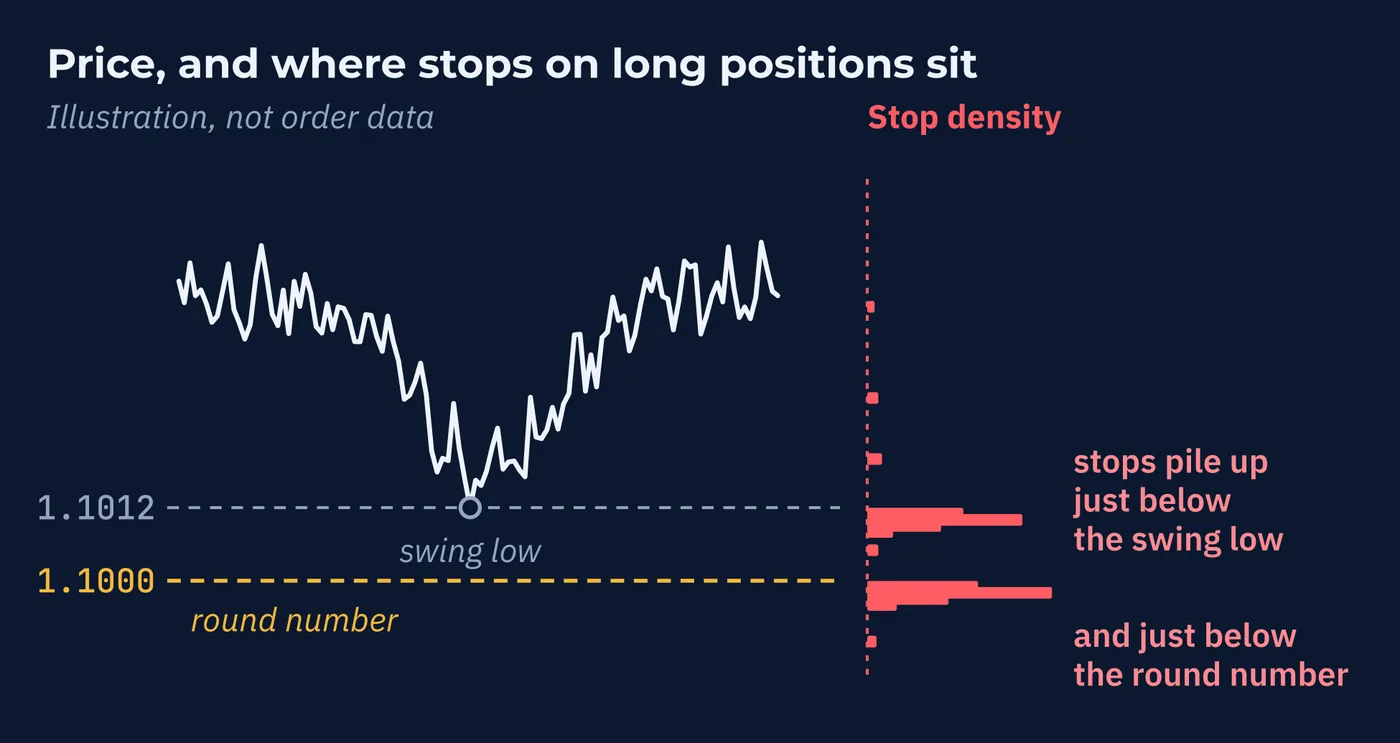
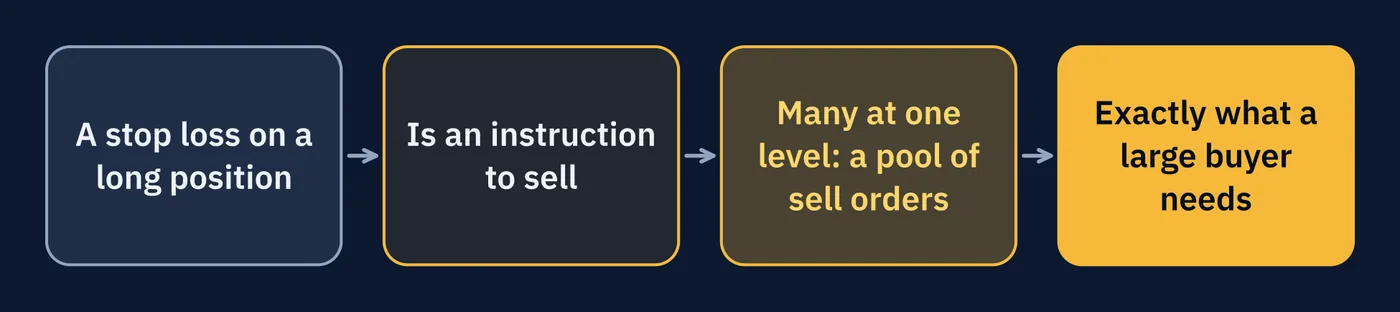
Now put the two facts together. A stop loss on a long position is an instruction to sell. So a cluster of stops is a pool of sell orders, sitting at a known level, waiting to be triggered.
Your stop loss is not a target. It is a counterparty.
4The Stop Hunt, Renamed
Here is the mechanism, described plainly.
A participant wants to build a large long position. They need sellers. A pool of sell orders sits just below an obvious support level. Price moves down through it, the stops trigger, and a wave of selling arrives.
The participant buys it. Then price reverses and goes up, because the buying was the point.
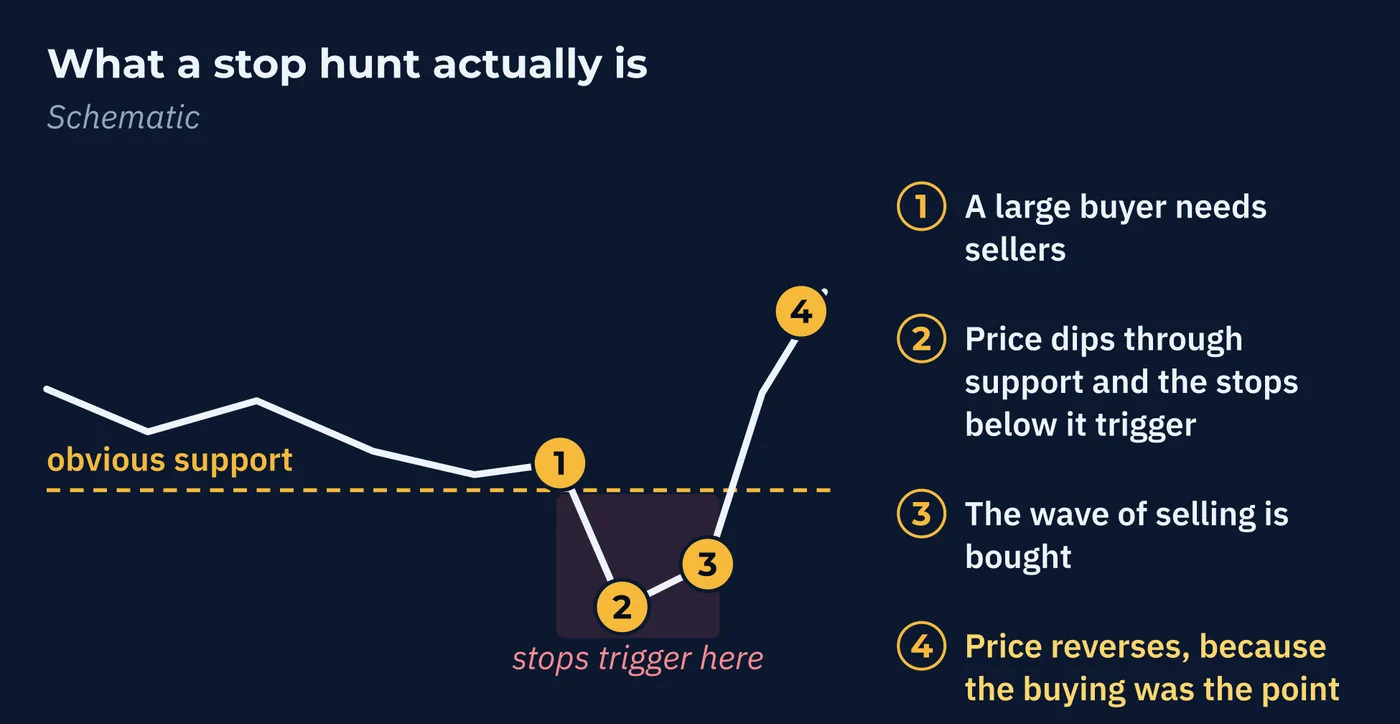
The name for this is a stop hunt, and the name is what causes the confusion.
| The Name Suggests | What Is Actually Happening |
|---|---|
| Someone is targeting you personally | Someone needs counterparties and knows where they concentrate |
| Your specific order was seen | The cluster is visible in aggregate, not your line in it |
| It is done out of malice | It is done because the alternative is a worse fill |
Nobody involved knows you exist. They know a few hundred million of sell orders sit under a level, and they need a few hundred million of sell orders.
It is a liquidity acquisition exercise with an unfortunate name.
5What Else Becomes Legible
Once liquidity is the organizing idea, several chart behaviors stop being mysterious.
| What You See | What It Often Is |
|---|---|
| A long consolidation before a big move | A large position being built in increments, absorbing supply without pushing price |
| A sharp break through a level that immediately reverses | Liquidity being generated at a known level, for a position in the opposite direction |
| Reactions at round numbers | Retail stops, option-related orders, and institutional limits concentrating at the same psychological level |
| Unusual flow in the last days of a month | The rebalancing from Lesson 42, arriving on schedule |
Read the second row again, because it inverts something. The sharp break that reverses is the most frustrating experience in retail trading. It is also the clearest visible sign of a participant building a large position in the other direction.
6The News Spike Is Different
One common experience has a different cause, and it is worth separating out.
In the minutes before a significant scheduled release, the order book changes. Spreads widen. Automated participants quote less. The depth available at any price thins sharply.
Into that thin market, an ordinary sized order produces an extraordinary sized move.
thin liquidity → small orders move price a long way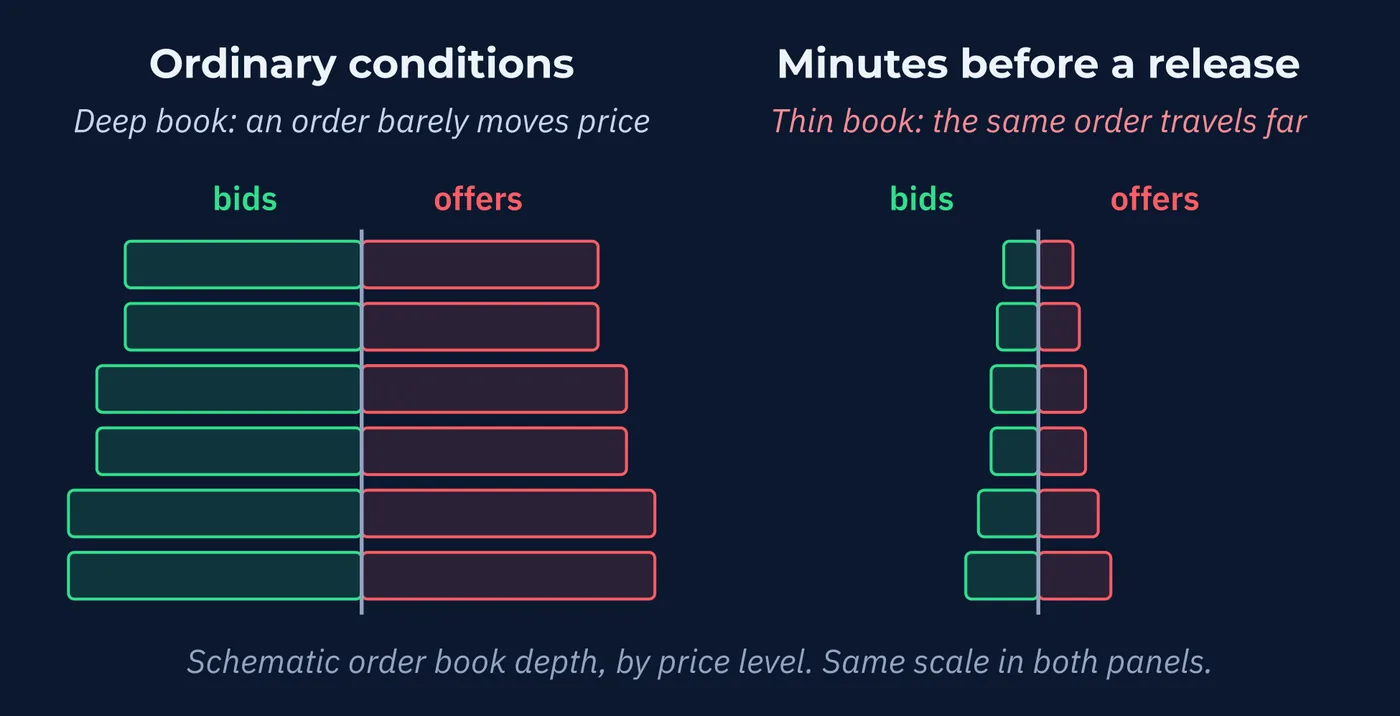
The result is often a sharp spike just before or as the announcement lands. It takes out stops placed near the current price. Then it reverses, and a sustained move follows in whatever direction the data warranted.
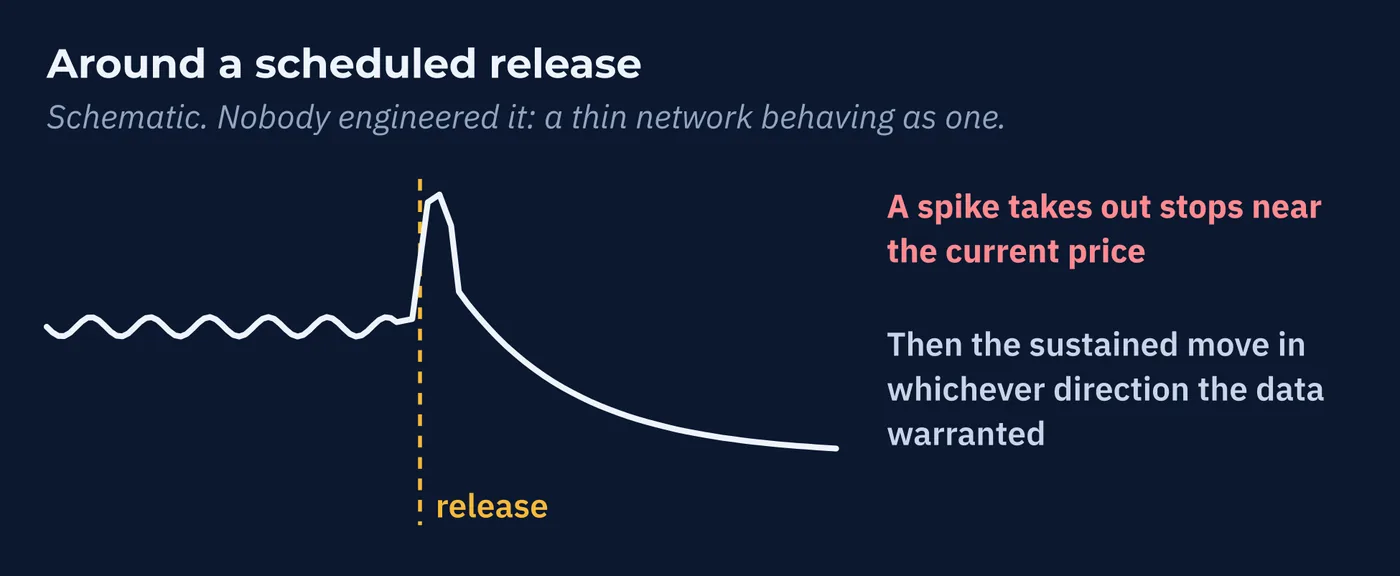
Nobody engineered that. It is the market structure from Lesson 40 behaving exactly as a thin network would.
Which is why Lesson 25 put the calendar check first, and why Lesson 22 treated scheduled releases as structural rather than incidental. The practical response is simple. Be flat before the release, or be sized so the spike alone cannot end the position.
7They Do Know More Than You
There is one respect in which the playing field is genuinely uneven, and pretending otherwise would be dishonest.
| Participant | What They Know First |
|---|---|
| A central bank | Its own policy intentions, before the announcement |
| A large commercial bank | Its clients' order flow, before it reaches the market |
| An individual trader | Public data, after it has been released and acted upon |
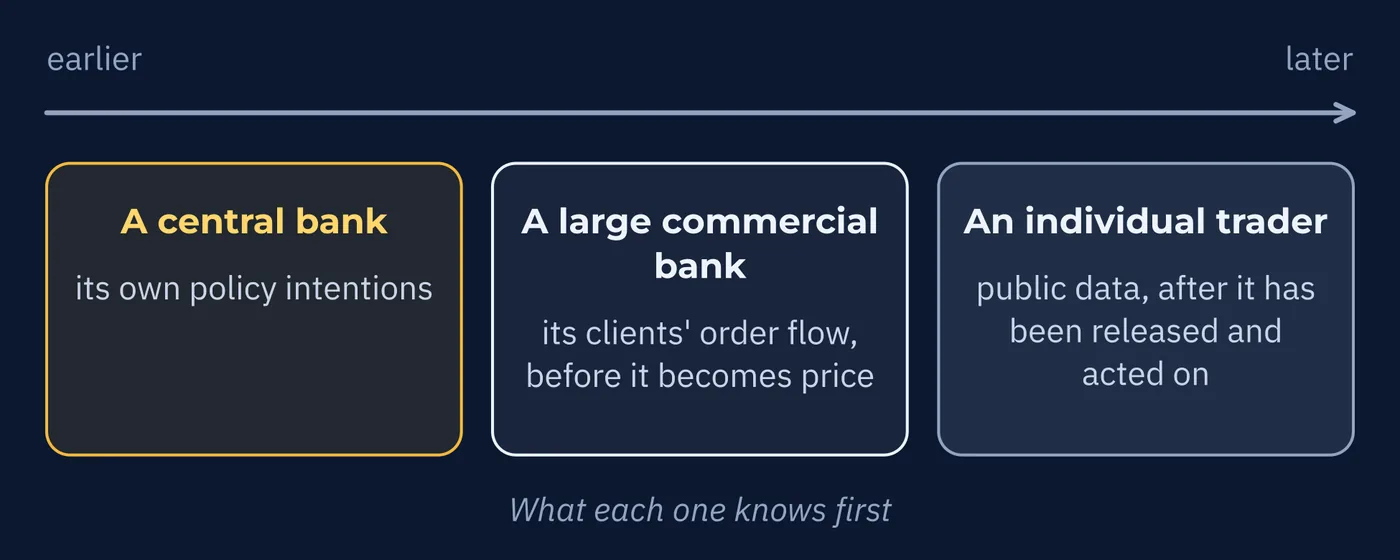
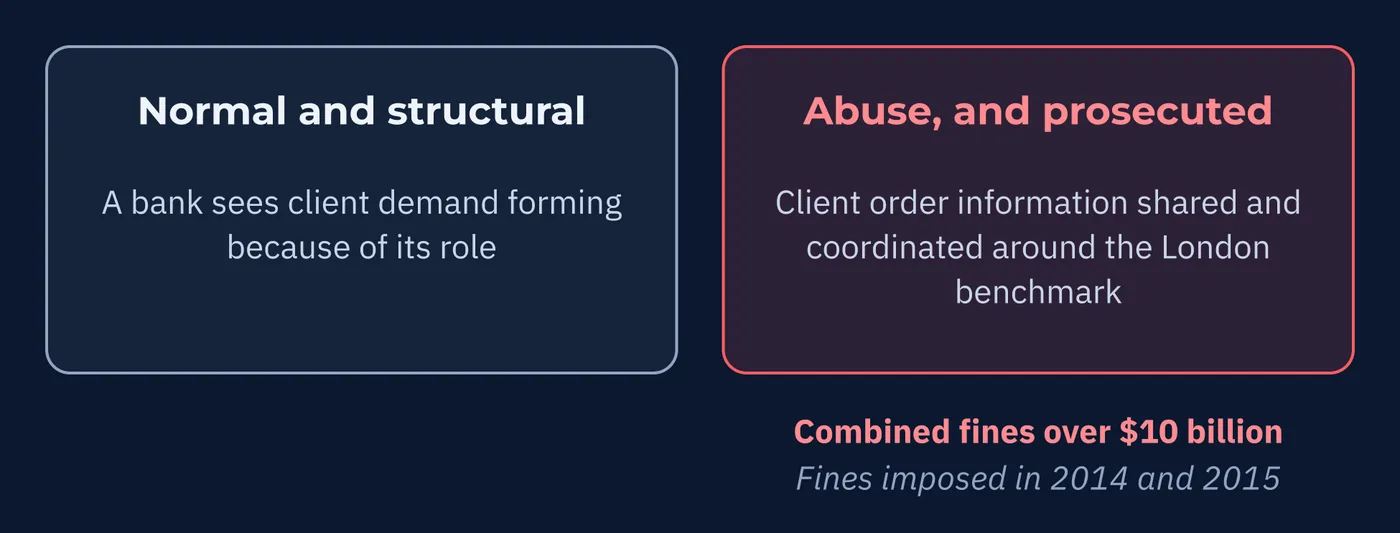
The middle row is the important one. A bank handling client flow sees demand forming before it becomes price. That follows from the role rather than abusing it, and it is the main reason large banks perform consistently well.
Where it crossed into abuse, it was prosecuted. A daily benchmark rate calculated in the London afternoon became the subject of record fines in 2014 and 2015, after a scandal that broke in 2013. Information about client orders had been shared and coordinated around it. Combined regulatory fines exceeded ten billion dollars.
The asymmetry is normal and structural. Acting on it in coordination is not, and it was punished heavily.
8What a Chart Actually Is
Everything in this series arrives at one reframe:
A chart is a record of what better-informed participants have already done.
Every candle is the visible residue of decisions already made, by participants acting earlier, with better information, for their own reasons. Lesson 3 taught you to read the marks. This series explains who made them.
Which changes what a trader is reasonably trying to do.

| Not This | But This |
|---|---|
| Outpredicting institutions | Reading the footprint they leave |
| Beating the market | Noticing when large flow is likely and why |
| Finding what nobody else can see | Understanding what everybody can see |
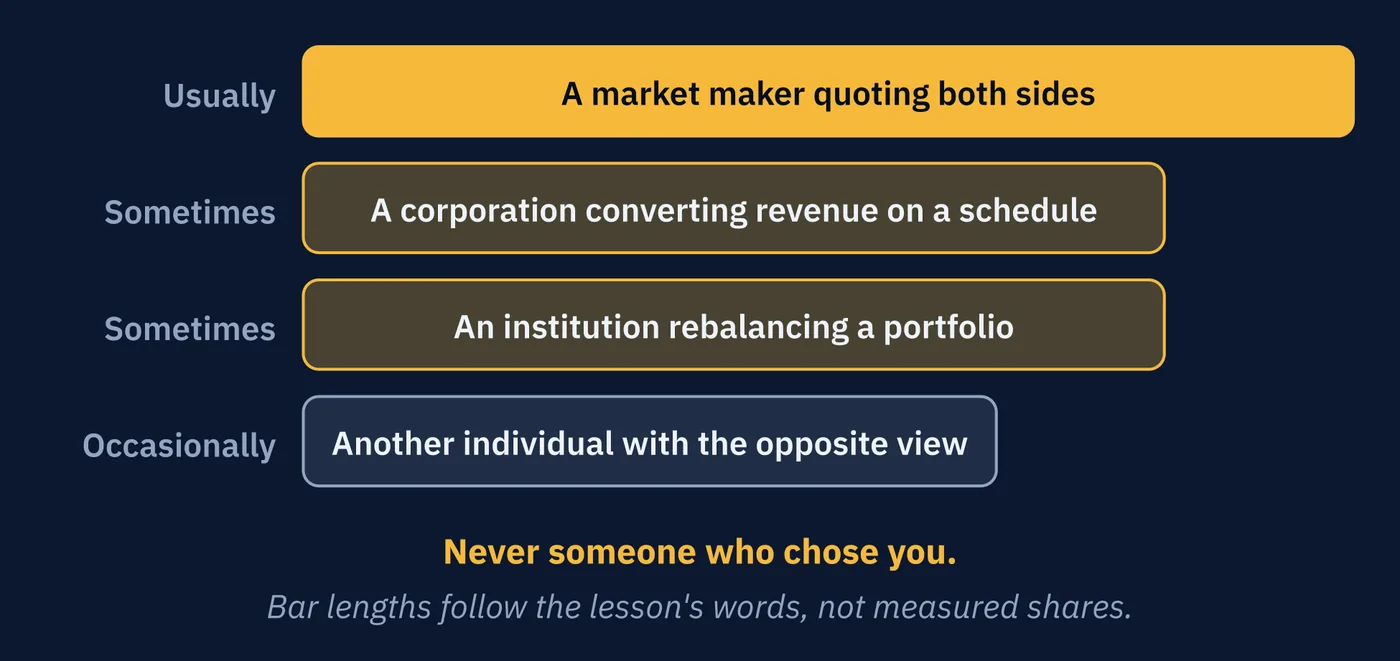
So, finally, who is on the other side of your trade?
Usually a market maker quoting both sides, as Lesson 42 described. Sometimes a corporation converting revenue on a schedule. Sometimes an institution rebalancing a portfolio. Occasionally another individual with the opposite view.
Never someone who chose you.
The market is enormous, decentralized, and made up overwhelmingly of participants meeting obligations rather than competing with anyone. That does not make trading easy. Lesson 1 was honest about how many people lose money. But those losses come from an unforgiving environment and thin preparation, not from a machine built to take your capital.
The next series returns to the pairs themselves, and to something Lessons 7 and 12 both raised and left unfinished. Why currencies move together, and what that means if you hold more than one position.
Three Things to Remember
Try This
Twenty minutes with a chart and an honest eye.
Words From This Lesson
| Term | What It Means |
|---|---|
| Liquidity | The ability to transact in size without the act of transacting moving the price against you. |
| Liquidity pool | A concentration of resting orders at a known level, which a large participant can transact against. |
| Stop cluster | Stop-loss orders piled up at the same level because most traders read the same chart the same way. |
| Stop hunt | A move through a level that triggers clustered stops, generating counterparties for a large position. Mechanical rather than personal. |
| Accumulation | Building a large position gradually, absorbing available supply without pushing price. |
| False break | A sharp move through a level that immediately reverses. Often liquidity being generated for a position in the other direction. |
| Information asymmetry | The structural condition where different participants hold different information at different times. |
Test Your Knowledge
Eight questions. Answer them all before checking the key on the following pages. If a question gives you trouble, the answer key tells you which section to revisit.
- A. Predicting direction accurately
- B. Avoiding regulatory scrutiny
- C. Finding enough counterparties to fill an order without moving price against themselves
- D. Minimizing the spread they pay
- A. Platforms place them automatically at set levels
- B. Large participants request specific levels
- C. Regulators require standard placement
- D. Most traders read the same chart and identify the same levels
- A. A pool of sell orders that can serve as counterparties
- B. A list of traders to target
- C. An obstacle to be avoided
- D. Evidence of market manipulation
- A. It implies personal targeting, when the participant is solving a liquidity problem
- B. Stops are never actually triggered
- C. Only crypto markets experience it
- D. It happens too rarely to name
- A. Indecision among retail traders
- B. A large position being built gradually without pushing price
- C. A technical error in the data
- D. Reduced trading hours
- A. Participants deliberately trigger stops before news
- B. Central banks trade into the release
- C. Platforms suspend pricing briefly
- D. Liquidity thins beforehand, so ordinary orders move price a long way
- A. They receive economic data before it is published
- B. They are told central bank decisions in advance
- C. They see client order flow before it reaches the market
- D. They can see individual retail stop orders
- A. A prediction of future price
- B. A record of what better-informed participants have already done
- C. A neutral mathematical construction
- D. A signal generated by the platform
Answer Key
Each answer explains why the correct choice is correct, why the others are not, and where to reread.
Question 1 · correct answer C
Buying aggressively into a thin market pushes the price up before the order is filled. Finding willing counterparties in volume at an acceptable price is the operational problem that shapes almost all large participant behavior.
A matters to some participants but is not the constraint that produces the patterns described here. B is a compliance matter rather than an execution one. D is a real cost but trivial at institutional scale compared with market impact.
Review: Section 2, The Problem Every Large Participant Has
Question 2 · correct answer D
Everyone identifies the same support levels, swing lows, and round numbers, so stops pile up in the same few places rather than spreading evenly across the range.
A describes automation that does not exist by default. C invents a rule. B reverses the causation, since the clustering happens without anyone requesting it.
Review: Section 3, Where the Sellers Are
Question 3 · correct answer A
A stop on a long position is an instruction to sell. A cluster of them is a pool of sell orders at a known level, which is exactly what a large buyer needs.
B implies individual targeting, which is the misconception this lesson corrects. C reverses it, since the pool is useful rather than obstructive. D misreads rational behavior as wrongdoing.
Review: Section 3, Where the Sellers Are
Question 4 · correct answer A
The participant knows a pool of orders sits under a level and needs counterparties. They do not know any individual trader exists, and the behavior would occur identically if you were not in the market.
B is wrong because stops are triggered, which is the whole mechanism. C is wrong because the pattern appears in currency markets and is documented there. D understates how frequently it occurs.
Review: Section 4, The Stop Hunt, Renamed
Question 5 · correct answer B
A large position cannot be built in one transaction without that transaction becoming the price move. Buying in increments absorbs supply at a level without driving price higher until the position is complete.
A describes an appearance rather than a cause. C treats normal market behavior as an error. D is wrong because the currency market runs continuously through the week.
Review: Section 5, What Else Becomes Legible
Question 6 · correct answer D
Spreads widen and automated quoting reduces before a release, so depth thins. In a thin market, ordinary orders produce outsized moves.
A attributes to intent what follows from structure. C is wrong because pricing continues, albeit with wider spreads. B is wrong because central banks do not routinely trade into scheduled data releases.
Review: Section 6, The News Spike Is Different
Question 7 · correct answer C
A bank intermediating client flow sees demand forming before it becomes price. That is a structural consequence of the market-making role and is the main reason large banks perform consistently well.
A is wrong because economic data is released simultaneously to all. B is wrong because policy decisions are not shared in advance with commercial banks. D is the misconception this lesson exists to correct.
Review: Section 7, They Do Know More Than You
Question 8 · correct answer B
Every candle is the visible residue of decisions already made by participants acting earlier and with better information. Lesson 3 taught reading the marks; this series explains who made them.
A treats a record of the past as a forecast. C ignores that prices are produced by participants with motives. D is wrong because the platform reports activity rather than generating it.
Review: Section 8, What a Chart Actually Is
Keep going
The Market Today is written by Kanin D. Alldredge for The Currency Classroom, and it is free to read. There is more free from CNS: start here.
Start free with CNS →