The Participants Up Close

1The Pyramid, Measured
Lesson 5 arranged the market as a pyramid. Central banks at the top with the most influence, retail traders at the base with the least.
That ordering was right. It just did not say how much.
The Bank for International Settlements survey measures who is on each side of every transaction. Here is what it finds.
| Who | Share of Volume | Who That Means |
|---|---|---|
| Other financial institutions | About 50 percent | Hedge funds, pension funds, asset managers, smaller banks |
| Reporting dealers | About 46 percent | The large global banks |
| Non-financial customers | About 5 percent | Corporations |
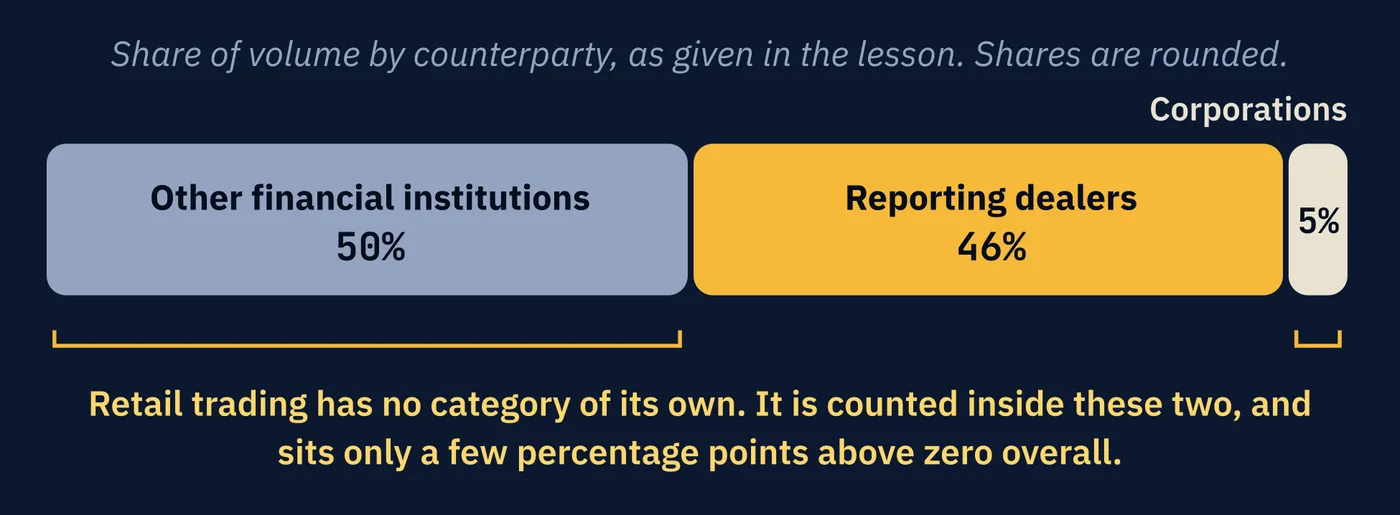
Those three add up to everything. Retail speculation does not appear as a fourth category because it is already buried inside two of them.
When an individual trades directly with a reporting dealer, that activity is counted under non-financial customers. When the trade reaches the dealer through a retail broker or aggregator, it is generally counted under other financial institutions, because the broker is the dealer's direct counterparty.
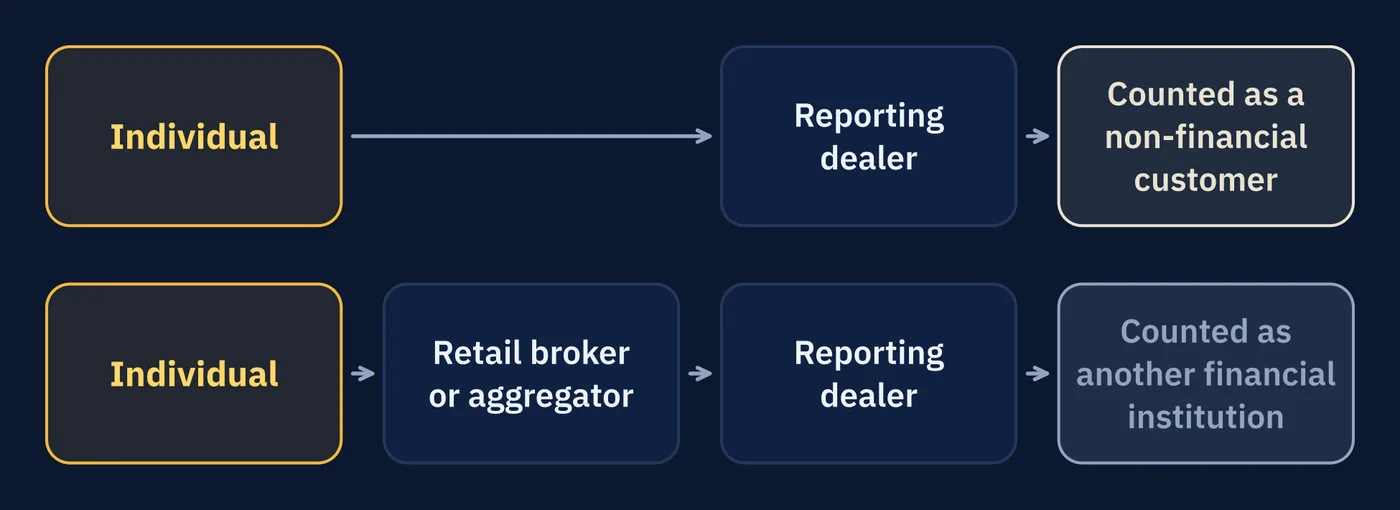
Essentially, retail trading sits only a few percentage points above zero in the overall market, making any individual retail trader little more than a rounding error in total volume.
2Not Here for Price
The more useful observation is not about size. It is about purpose.
Look at the table again and ask what each group is doing. Pension funds rebalancing holdings. Banks handling client flow. Corporations converting revenue. Central banks implementing policy.
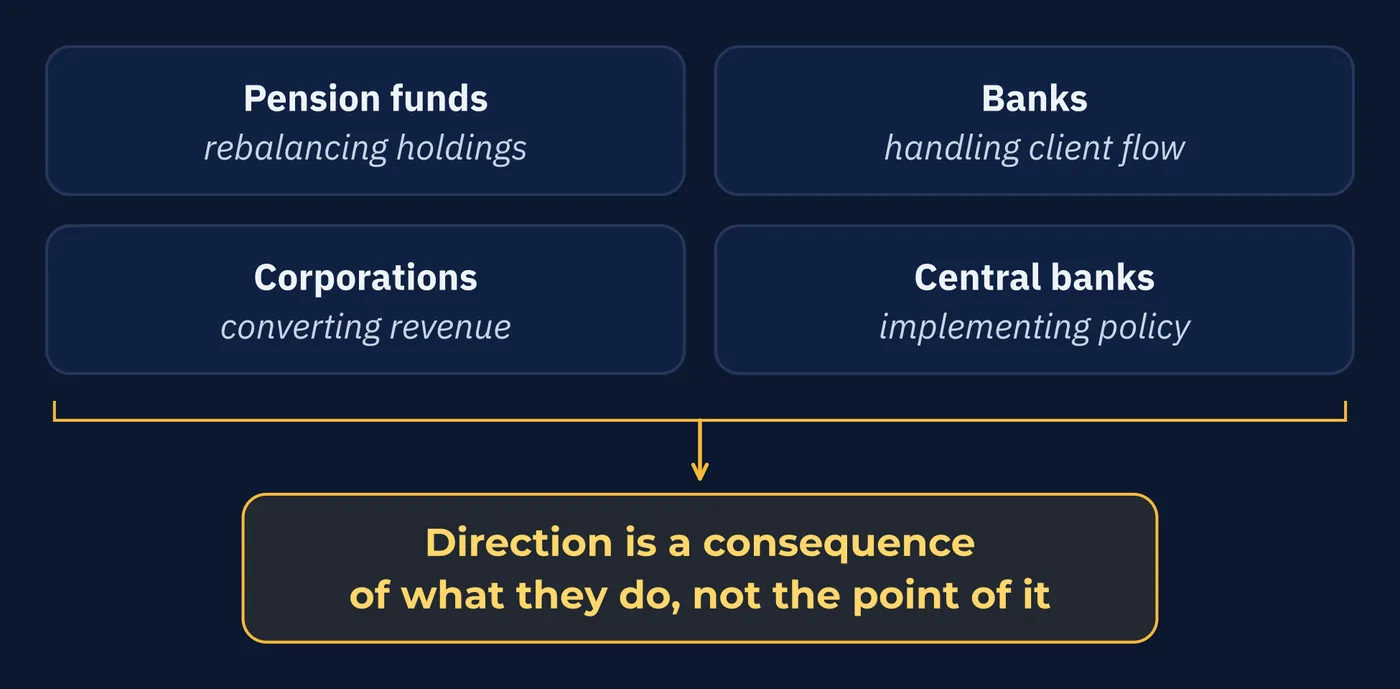
Well over ninety percent of this market is not trying to profit from price direction at all.
They are implementing policy, meeting mandates, hedging exposures, and rebalancing portfolios. Direction is a consequence of what they do, not the point of it.
3Central Banks Price Expectations
Lesson 5 put central banks at the top. Lesson 1 said their rate decisions move currencies. Both true, and both incomplete in the same way.
Markets do not price the current interest rate. They price the rate they expect.
Which produces something that confuses people the first time they watch it happen.
| What the Decision Does | What the Price Does |
|---|---|
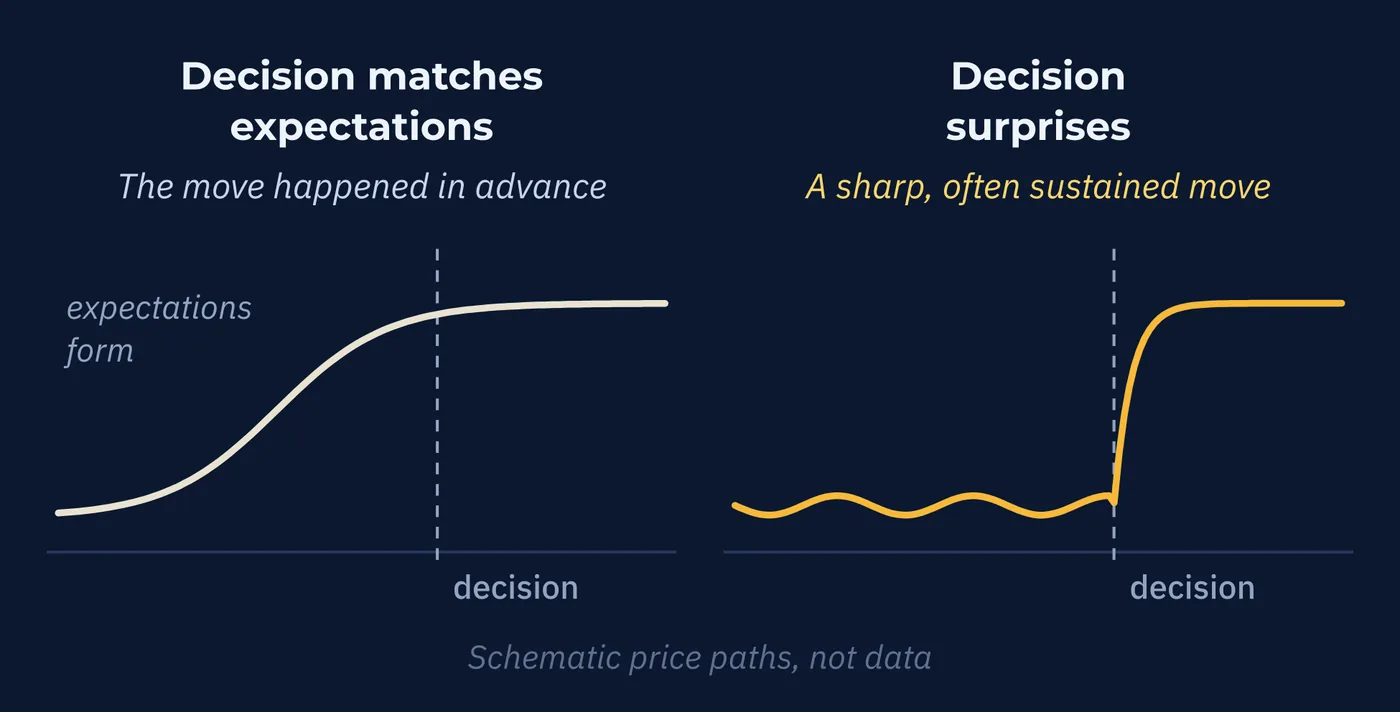
| Matches what the market expected | Very little. The move already happened, in advance. |
| Comes in higher or lower than expected | A sharp and often sustained move |
A rate rise everyone predicted is not news. It was priced in over the preceding weeks, as expectations formed.
A surprise is different. The market must reprice not just today's rate but the whole expected path of future rates, at once. Those are the sharpest moves on the calendar.
It also explains why the words matter as much as the number. A central bank can hold rates steady, signal a different future direction, and move a currency more than one that changed rates as expected. Lesson 29 called credibility the pillar that moves fastest. This is what that looks like in an afternoon.
4Commercial Banks Make the Price
The large banks from Lesson 40's engine room do something specific, and it has a name.
Market making means continuously quoting both a price at which you will buy and a price at which you will sell, and standing ready to do either.
Which reframes the bid and ask from Lesson 2. Those two numbers are not a description of the market. They are an offer from an institution willing to take either side.
A market maker is not predicting direction. It earns the difference between the two prices, repeated across enormous volume, while managing the inventory it builds up as clients trade against it.
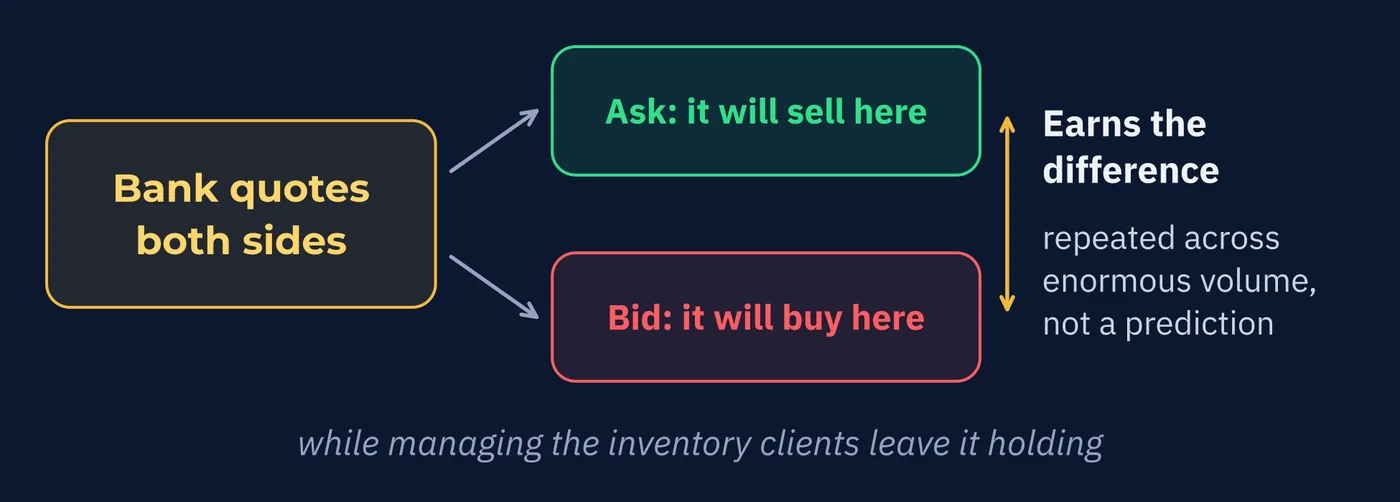
Which is why the spread exists at every layer, as Lesson 40 described. Each layer quotes both sides and earns the difference for doing so.
5Currency as a Side Effect
The largest single category, at about 50 percent, is the one with the least obvious motivation.
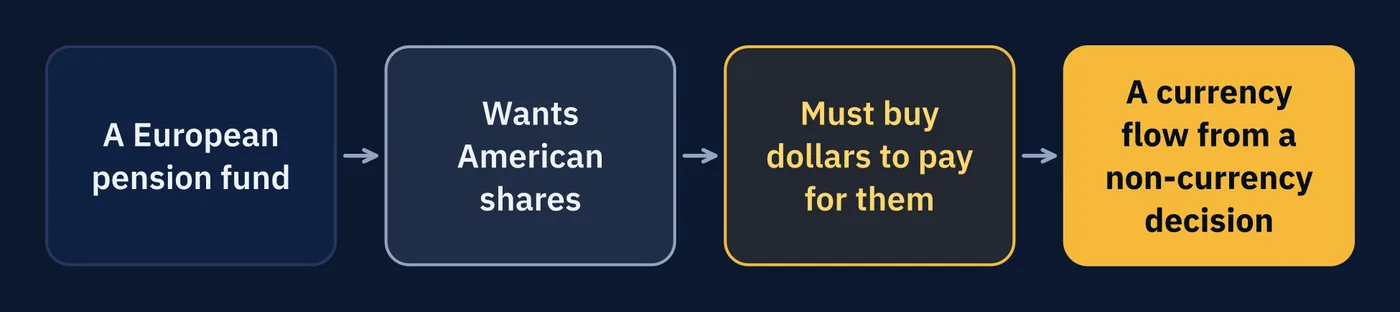
A European pension fund holding American shares did not want dollars. It wanted the shares. The dollars were a requirement of buying them.
Which means enormous currency flows are generated by decisions that had nothing to do with currencies.
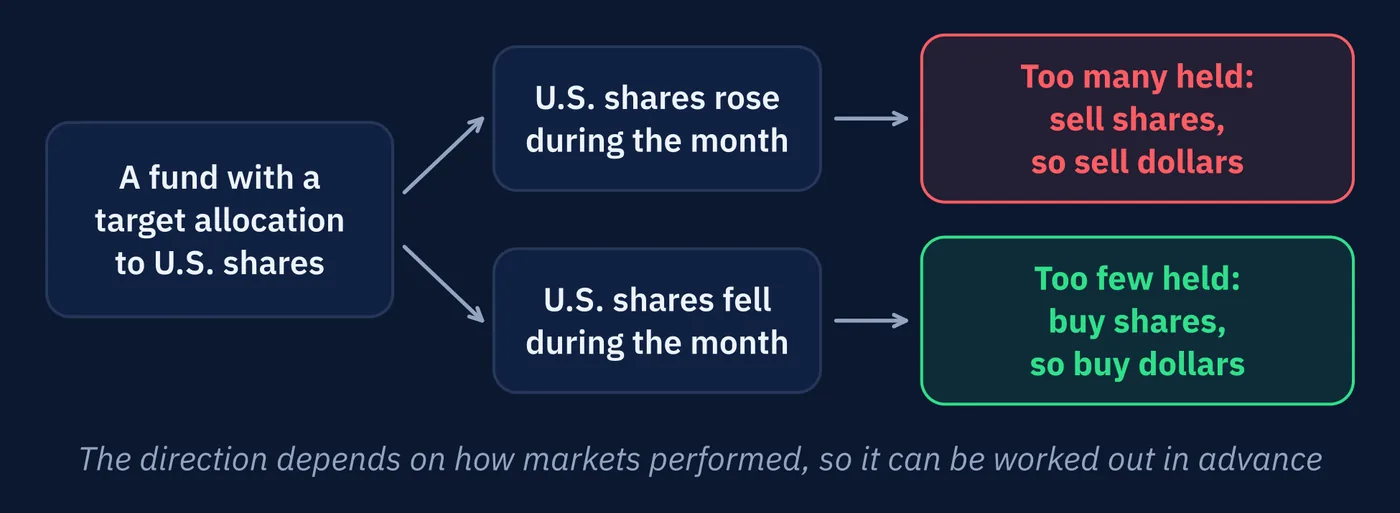
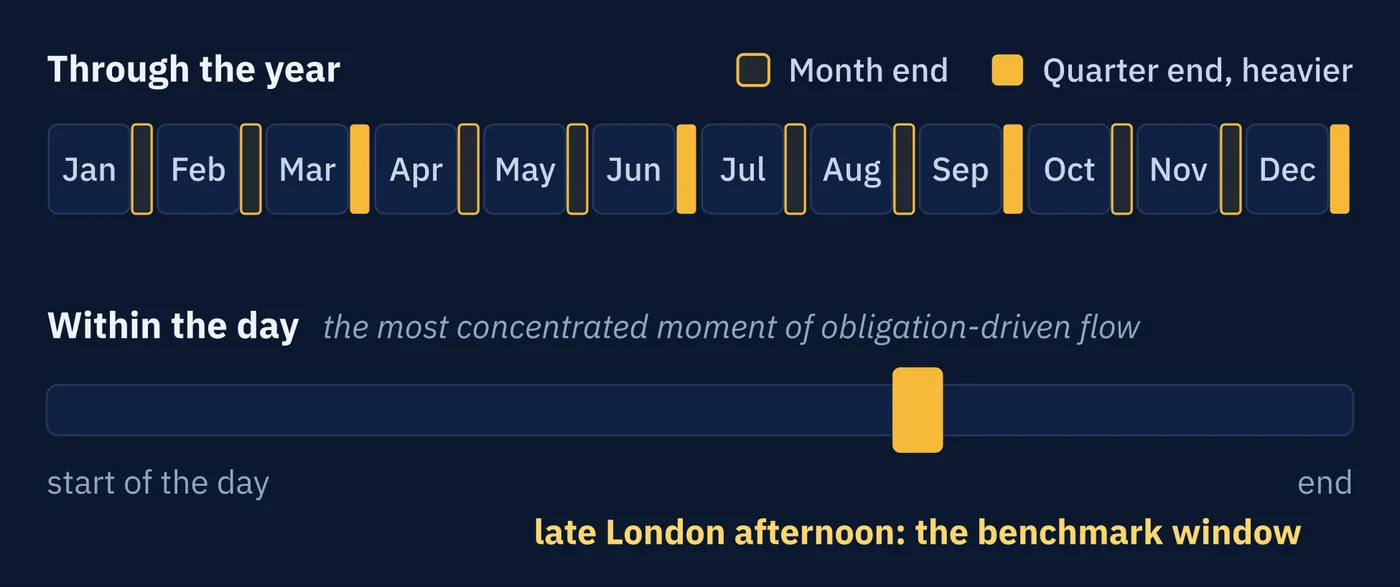
There is a related concentration during the day. A benchmark rate is calculated in the late London afternoon. Institutions obliged to transact at that benchmark all trade into the same short window. It is the most concentrated moment of obligation-driven flow in the day.
Neither of those is a secret. Both are consequences of how institutional mandates work.
6Corporations Trade a Calendar
The 5 percent from corporations is the most predictable flow in the market, because it is driven by business rather than by opinion.
A company converting foreign revenue does it when the revenue arrives. A company hedging a future payment does it when the contract is signed. Neither is timing the market. Neither will wait for a better rate if waiting means missing payroll.
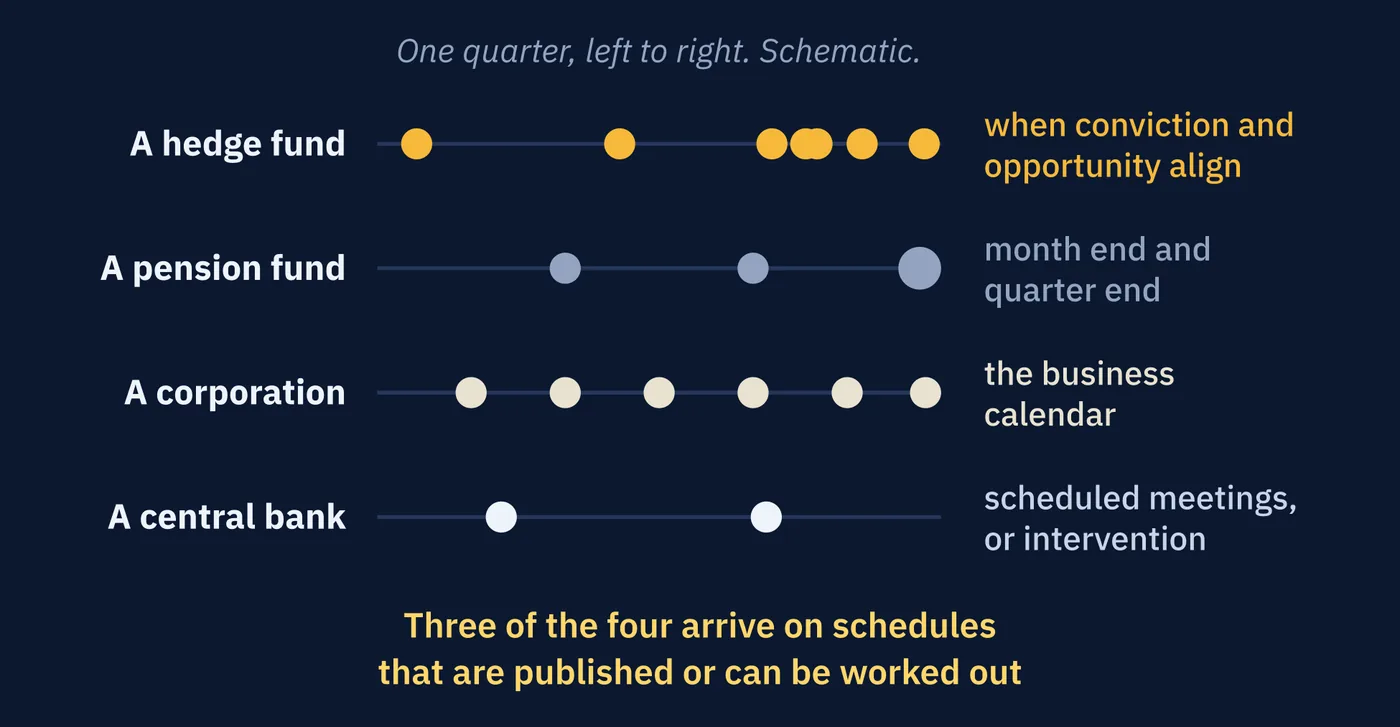
| Participant | Decides Based On | So the Flow Arrives |
|---|---|---|
| A hedge fund | A view on where price is going | Whenever conviction and opportunity align |
| A pension fund | Portfolio weights against targets | At month end and quarter end |
| A corporation | Invoices, payroll, and contract dates | On the business calendar |
| A central bank | Policy objectives | At scheduled meetings, or during intervention |
Read the right-hand column. Three of those four rows arrive on schedules that are published or inferable.
7Reading Rather Than Competing
Put the whole picture together and something practical falls out.
A retail trader is not in a contest with these participants. There is no contest, because they are not playing. They are generating repeating, calendar-driven pressure on price, as a by-product of obligations they have to meet.
You are not competing with the flow. You are trying to notice it.
Which reframes several things this course has already covered.
| Earlier Lesson | What It Now Means |
|---|---|
| Lesson 22, why sessions matter | Different participants are awake and acting in each one |
| Lesson 23, why the overlap is busiest | Two centers of institutional flow are active at once |
| Lesson 25, checking the calendar first | Scheduled events are when the largest participants act |
None of that requires predicting anything. It requires knowing when the people who move the most money are likely to move it. That is largely a matter of looking things up.
8The Honest Limit
This picture is genuinely useful and it should not be oversold.
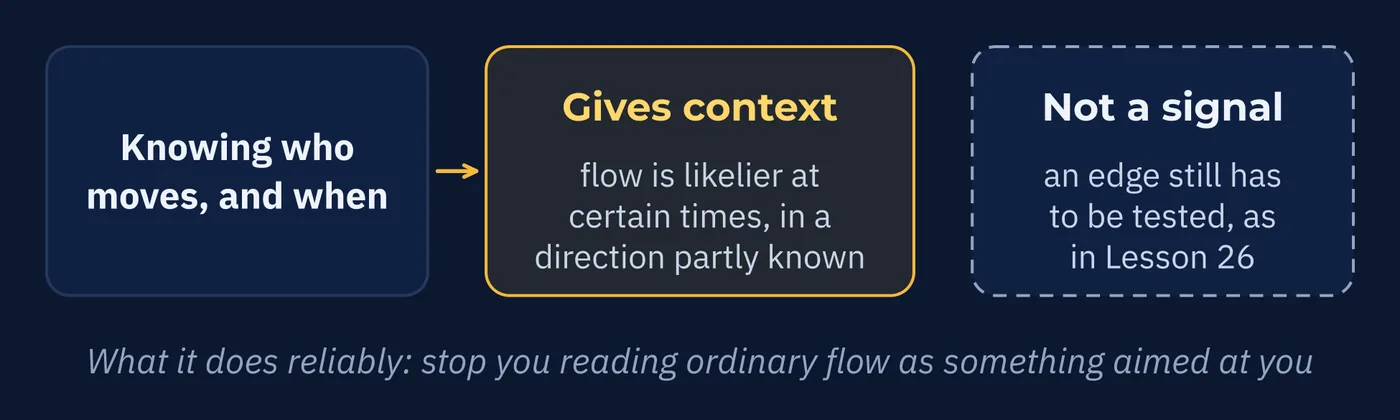
One participant is missing from this lesson, and it is the one every retail trader wonders about. If ninety-odd percent of the market is not trying to beat anyone, who is on the other side of your trade?
That is the next lesson, and it closes the series.
Three Things to Remember
Try This
Twenty minutes, spread across a few days rather than done at once.
Words From This Lesson
| Term | What It Means |
|---|---|
| Reporting dealers | The large global banks that report transaction data to the BIS. About 46 percent of volume. |
| Other financial institutions | Hedge funds, pension funds, asset managers, and smaller banks. The largest category at about 50 percent. |
| Market making | Continuously quoting both a buying and a selling price, and standing ready to take either side. |
| Obligation-driven flow | Currency transactions that must happen because of a mandate, contract, or business need rather than a view on price. |
| Rebalancing | Adjusting a portfolio back to its target weights. Concentrates at month end and quarter end. |
| Priced in | Already reflected in the current price because the market expected it. |
| Forward guidance | A central bank signaling its likely future policy direction. Can move a currency more than the decision itself. |
Test Your Knowledge
Eight questions. Answer them all before checking the key on the following pages. If a question gives you trouble, the answer key tells you which section to revisit.
- A. Other financial institutions
- B. Reporting dealers, the large global banks
- C. Non-financial corporations
- D. Retail traders
- A. About 50 percent
- B. About 20 percent
- C. About 46 percent
- D. About 5 percent
- A. It comes from participants trying to profit from direction
- B. It is generated by central banks
- C. It comes from participants not primarily trading direction at all
- D. It occurs during the London session
- A. A sharp rally in the currency
- B. Very little, because it was already priced in
- C. A sharp fall in the currency
- D. Trading is suspended briefly
- A. The market must reprice the whole expected future path of rates at once
- B. It triggers automatic stop orders
- C. Central banks trade heavily after surprises
- D. Liquidity providers withdraw
- A. Predicting direction and taking large positions
- B. Creating new currency
- C. Quoting both a buying and a selling price and standing ready to take either side
- D. Matching buyers with sellers for a fee
- A. Trading costs are lower then
- B. Funds must rebalance portfolios back to target weights
- C. Central banks meet monthly
- D. Corporations pay salaries then
- A. A reliable signal for entries
- B. Access to institutional pricing
- C. A way to trade against institutions
- D. Context about when and why flow is likely, which is not a signal
Answer Key
Each answer explains why the correct choice is correct, why the others are not, and where to reread.
Question 1 · correct answer A
Other financial institutions, meaning hedge funds, pension funds, asset managers, and smaller banks, account for about 50 percent. The largest single category.
B is close behind at about 46 percent but not the largest. C is about 5 percent. D is an estimated 3 to 5 percent, and that estimate sits inside the other categories.
Review: Section 1, The Pyramid, Measured
Question 2 · correct answer D
Non-financial customers, which is mostly corporations, account for about 5 percent. Small in volume but the most predictable flow in the market.
B does not correspond to any category. C is the share from large global banks. A is the share from other financial institutions.
Review: Section 1, The Pyramid, Measured
Question 3 · correct answer C
They are implementing policy, meeting mandates, hedging exposures, and rebalancing portfolios. Direction is a consequence of what they do rather than the purpose of it.
A reverses the finding and is the common assumption. B overstates central banks, which are influential but a small share of routine volume. D describes when volume is highest, not who generates it.
Review: Section 2, Not Here for Price
Question 4 · correct answer B
Markets price expected rates rather than current ones. If the decision matched expectations, the move already happened as those expectations formed.
A and C both assume the decision itself is the news, which is what this section corrects. D describes a mechanism that does not apply here.
Review: Section 3, Central Banks Price Expectations
Question 5 · correct answer A
A surprise forces the market to reassess not just today's rate but the entire expected future path, all at once. That produces the sharpest moves on the calendar.
B describes a secondary effect rather than the cause. C is wrong because central banks do not typically trade in response to their own decisions. D can happen briefly but is not the reason for the size of the move.
Review: Section 3, Central Banks Price Expectations
Question 6 · correct answer C
A market maker quotes both sides continuously and earns from the difference across large volume, while managing the inventory it accumulates.
A describes a speculative participant, which is a different role. B describes what central banks and commercial bank lending do, covered in Lesson 30. D describes an exchange, and this market has none.
Review: Section 4, Commercial Banks Make the Price
Question 7 · correct answer B
Funds with target allocations must periodically return to them. If one market outperformed during the period, they hold too much of it and must sell, which generates currency flow.
A is not the driver, and costs do not fall at month end. C is wrong because meeting schedules vary and are not monthly for all central banks. D is a real flow but far too small to explain the pattern.
Review: Section 5, Currency as a Side Effect
Question 8 · correct answer D
It indicates when flow is more likely and in roughly what direction. That is context. An edge still has to be defined and tested, as Lesson 26 established.
A overstates it considerably and is the mistake this section warns against. C misunderstands the point, since these participants are not opponents. B is wrong because access is unchanged by understanding.
Review: Section 8, The Honest Limit
Keep going
The Market Today is written by Kanin D. Alldredge for The Currency Classroom, and it is free to read. There is more free from CNS: start here.
Start free with CNS →