Where Money Comes From

1The Model Most People Carry
Ask where money comes from and most people describe roughly the same picture. The government prints it. A central bank oversees the process. Money enters the world at a press and spreads outward.
That picture is not exactly wrong. It is incomplete because it misses where most money actually comes from.
Most money is not printed. It is lent into existence.
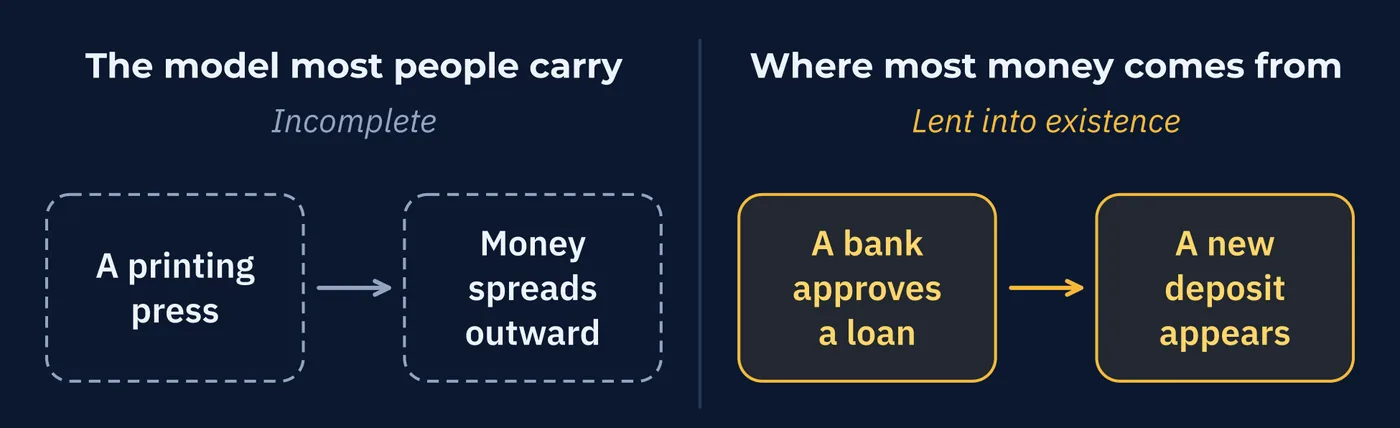
That sounds like a provocation. It is just a description of how banking works, and central banks say so themselves. The Bank of England has published it in plain language.
Working out how takes one example.
2Every Loan Creates a Deposit
Picture a bank approving a mortgage. Two hundred thousand.
The intuitive assumption is that the bank finds two hundred thousand somewhere, perhaps from other customers' savings, and hands it over. Money moves from one place to another.
That is not what happens. The bank types a number into an account.
loan approved → new deposit appears → money supply growsThe deposit did not exist before the loan was approved. It was not taken from anywhere. It was created at the moment of approval. The money supply in that economy is now two hundred thousand larger than it was that morning.
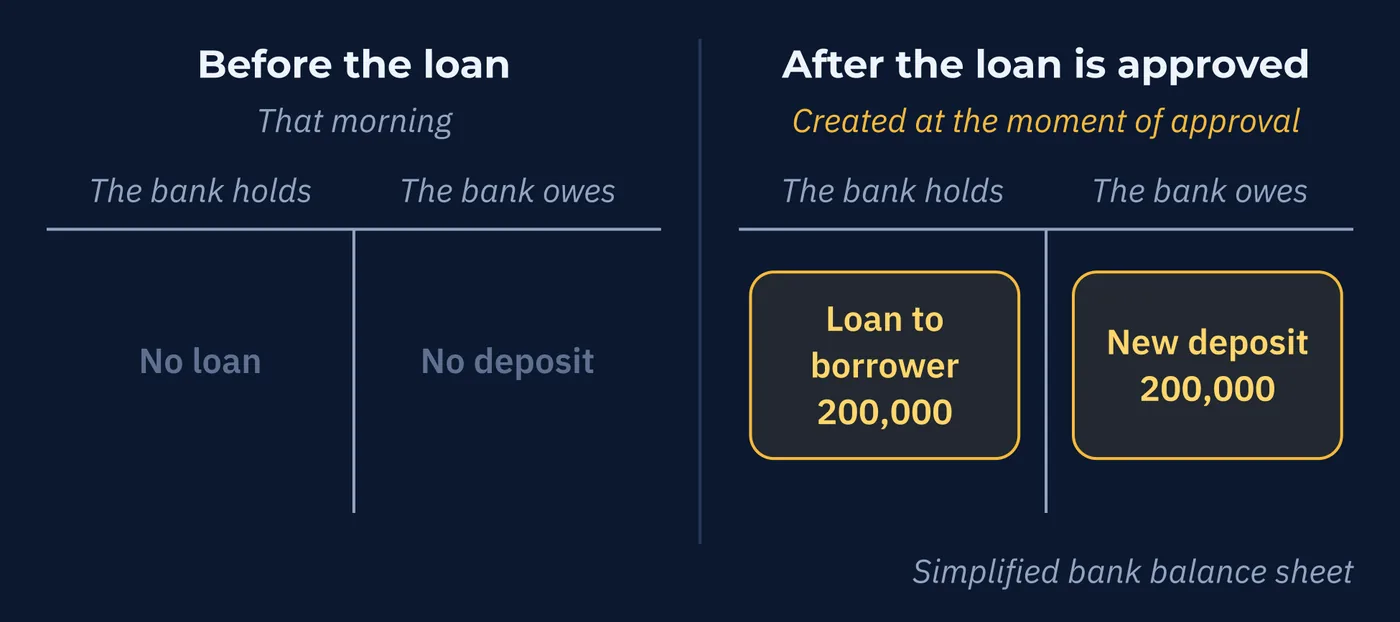
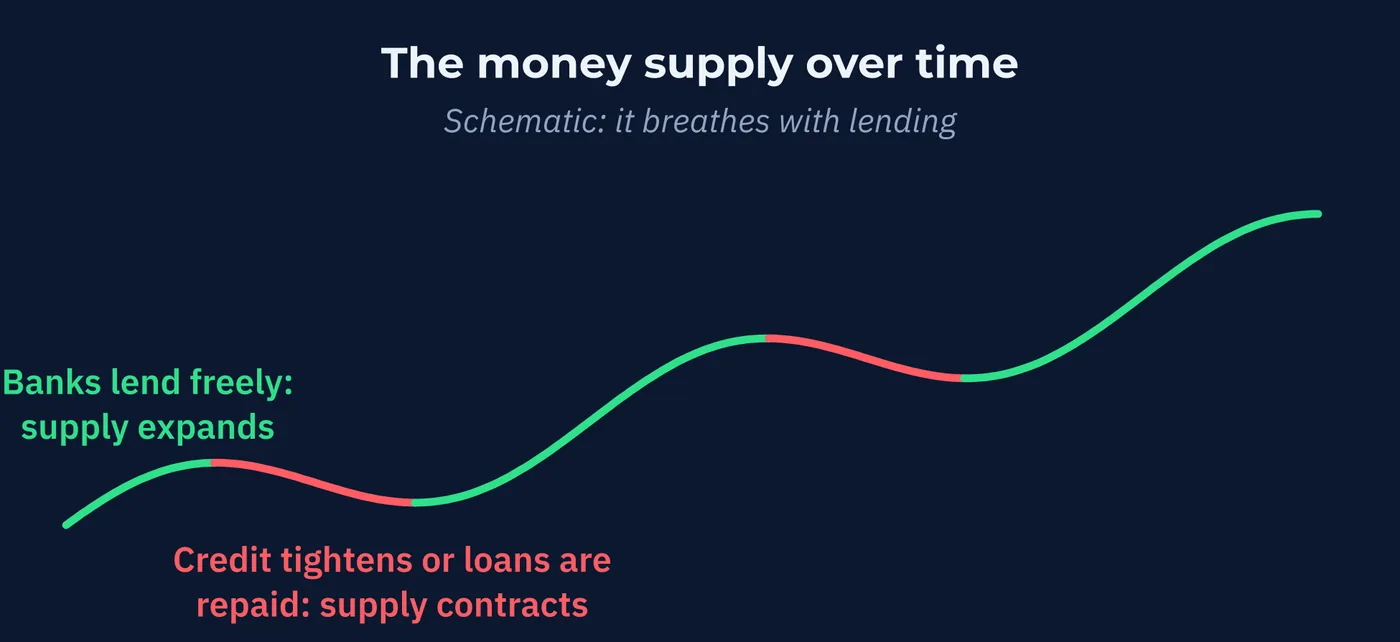
The process runs backward too. When the loan is repaid, that money is extinguished rather than passed along. The supply shrinks.
Which produces a picture quite different from a printing press.
| When | What Happens to the Money Supply |
|---|---|
| Banks lend freely and borrowing is in demand | It expands |
| Credit tightens, or loans are repaid faster than new ones are made | It contracts |
The total money in an economy is not a fixed amount controlled from above. It breathes, and it breathes with lending.
3What Central Banks Actually Control
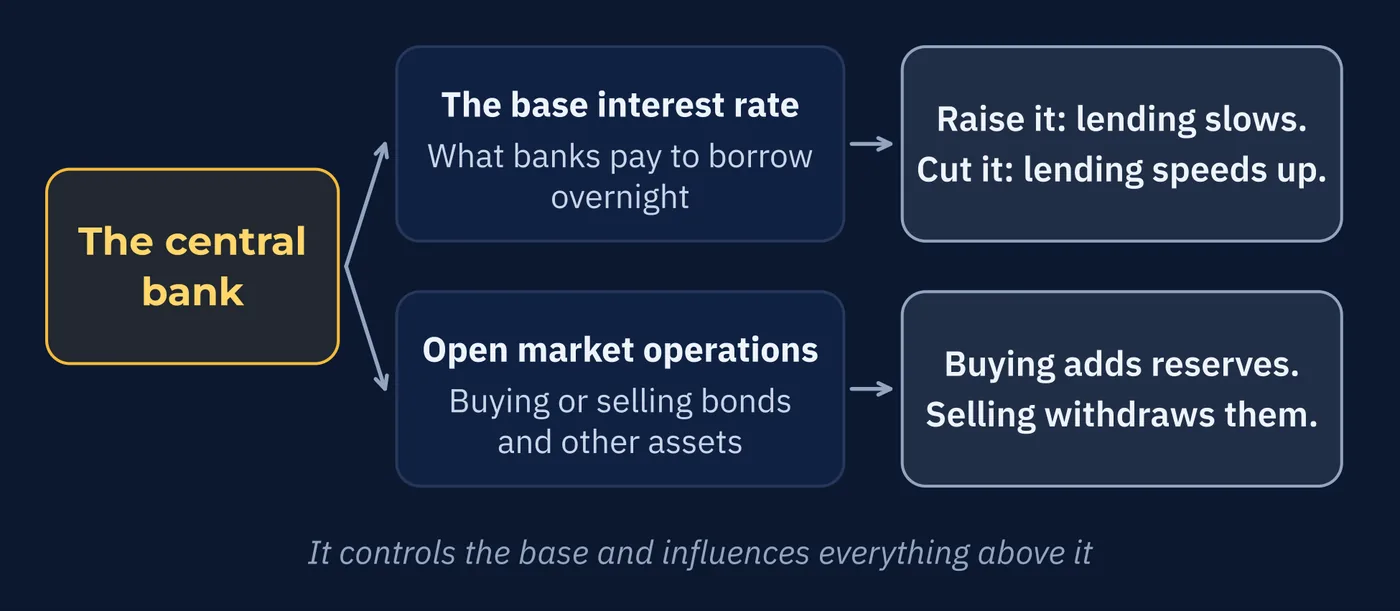
So what does a central bank do, if it is not making most of the money?
It controls the base and influences everything above it, using two main tools.
| Tool | How It Works | Effect |
|---|---|---|
| The base interest rate | Sets what banks pay to borrow overnight | Raise it and lending slows. Cut it and lending accelerates. |
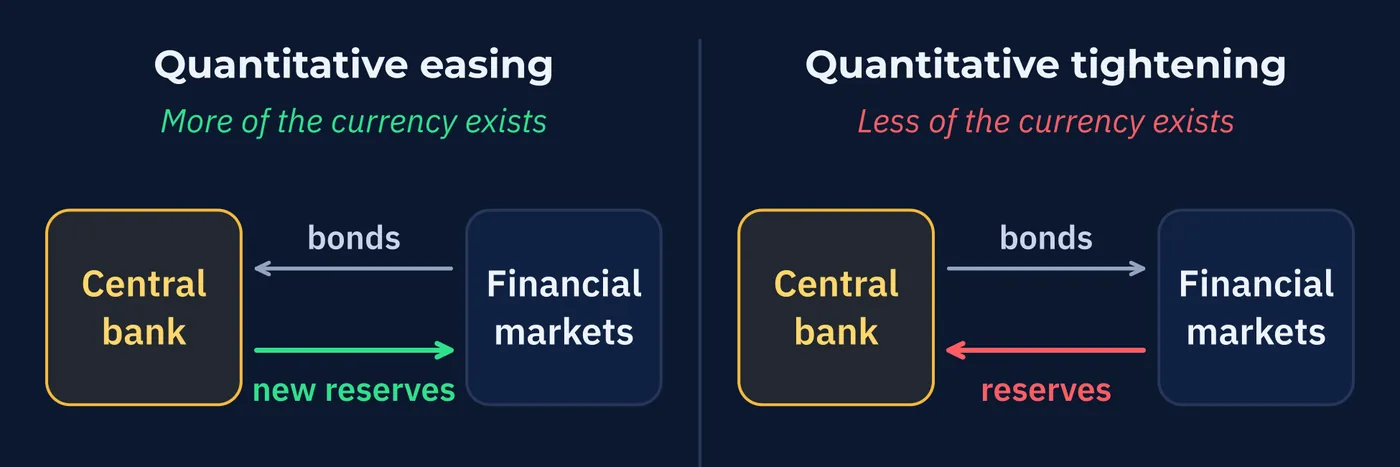
| Open market operations | Buys or sells government bonds and other assets | Buying injects new reserves. Selling withdraws them. |
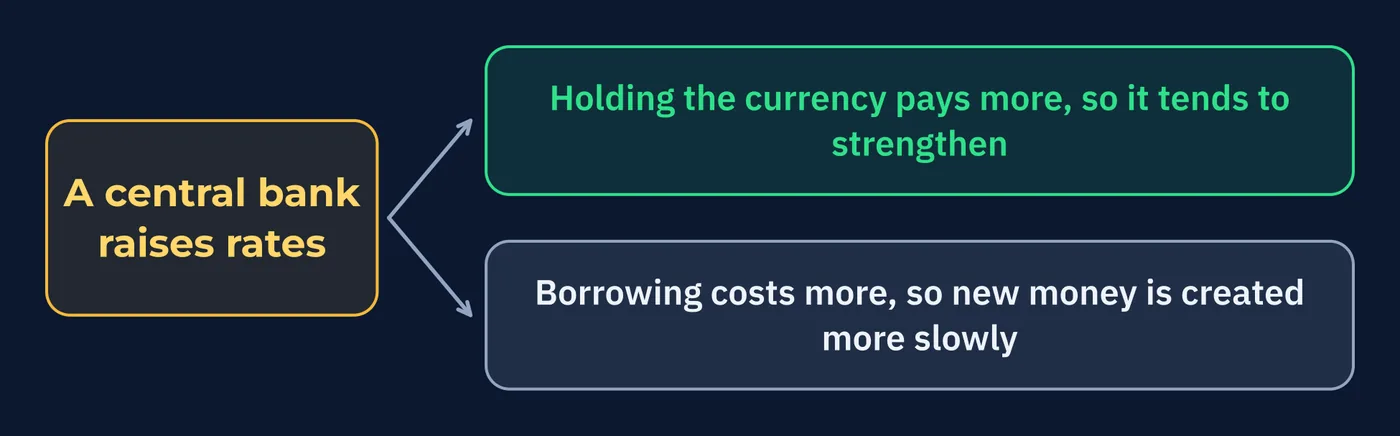
The first is the lever from Lesson 1, seen from the other side. Raising rates attracts money to a currency, so the currency strengthens. It also makes borrowing more expensive across the system, which slows the pace at which banks create new money.
So an interest rate decision does two things at once. It changes what holding the currency pays, and it changes how fast new currency is coming into existence.
4Measuring the Money
Because the money supply moves, it gets measured. There are four common measures, three of them nested inside each other, and they turn up constantly in central bank language.
| Measure | What It Includes | Who Controls It |
|---|---|---|
| M0 | Physical cash plus bank reserves at the central bank | The central bank, directly |
| M1 | Cash in circulation plus current accounts and instantly spendable deposits | Mostly the banking system |
| M2 | In most definitions, M1 plus savings accounts, money market accounts, short-term deposits | Mostly the banking system |
| M3 | M2 plus large time deposits and less liquid instruments | Mostly the banking system |
Only the first line is under direct control. Everything below it grows and shrinks with lending. That is why central banks influence the money supply rather than set it.
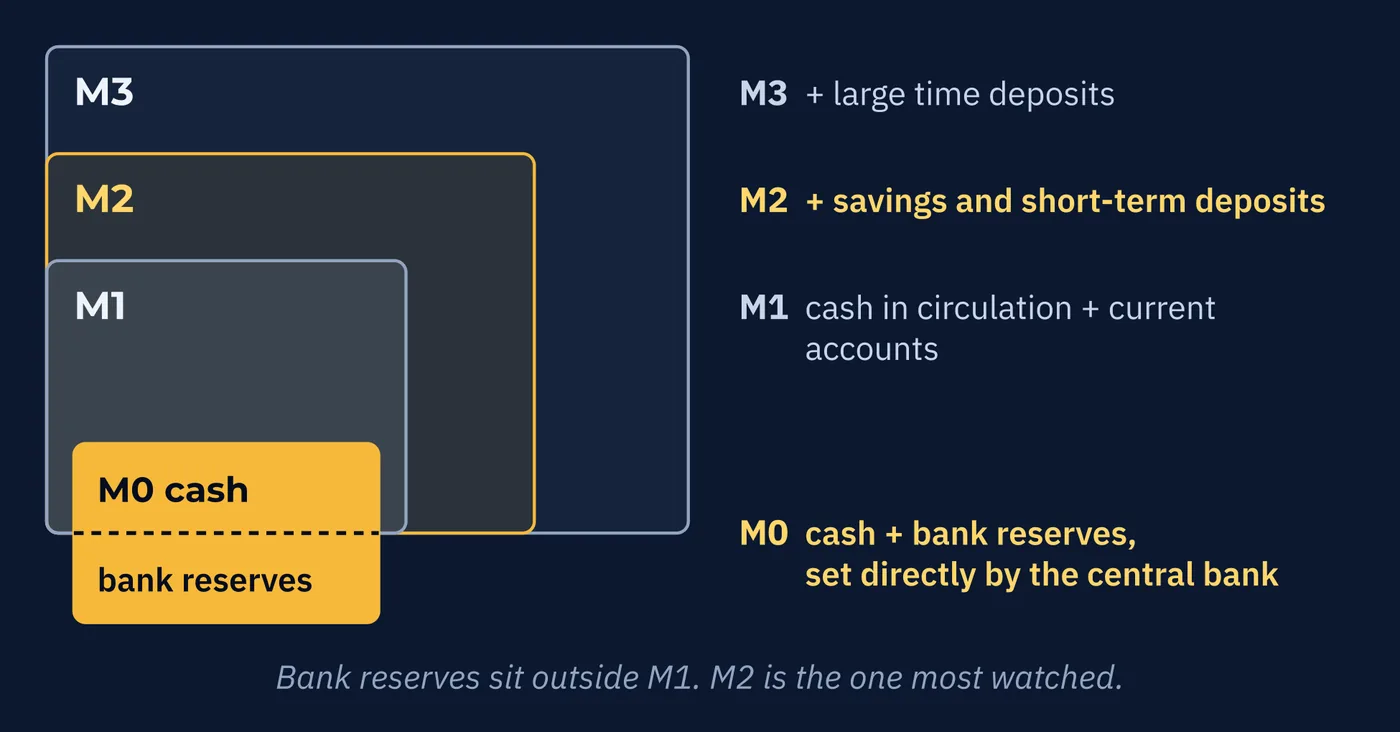
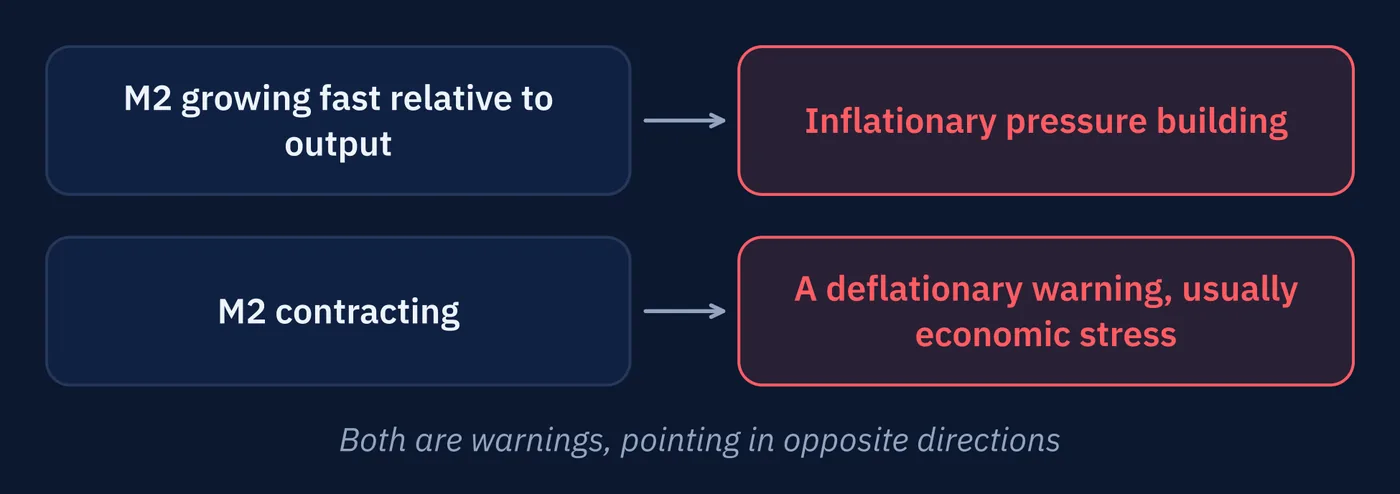
The one to remember is M2. It is the most widely watched measure in the United States and most major economies. When someone mentions money supply growth without saying which, they usually mean this.
| If You See | It Signals |
|---|---|
| M2 growing rapidly relative to economic output | Inflationary pressure building |
| M2 contracting | A deflationary warning, and usually economic stress |
That one line of vocabulary turns a lot of opaque commentary into something readable. The European Central Bank tracks M3 as its main broad measure. The US Federal Reserve stopped publishing M3 in 2006, judging M2 sufficient.
5Why Two Percent
Nearly every major central bank targets inflation of about two percent a year.
Which invites an obvious question. If inflation erodes what money buys, why aim for any at all? Why not zero, so that money holds its value?
There are two primary reasons, and a third practical reason.
The first is that mild inflation discourages sitting on money. If prices will be slightly higher next year, holding cash has a small cost and putting it to work has a small advantage. Multiply that nudge across an economy and it keeps capital moving.
The second is about what happens on the other side of zero, and central banks consider it much more dangerous.
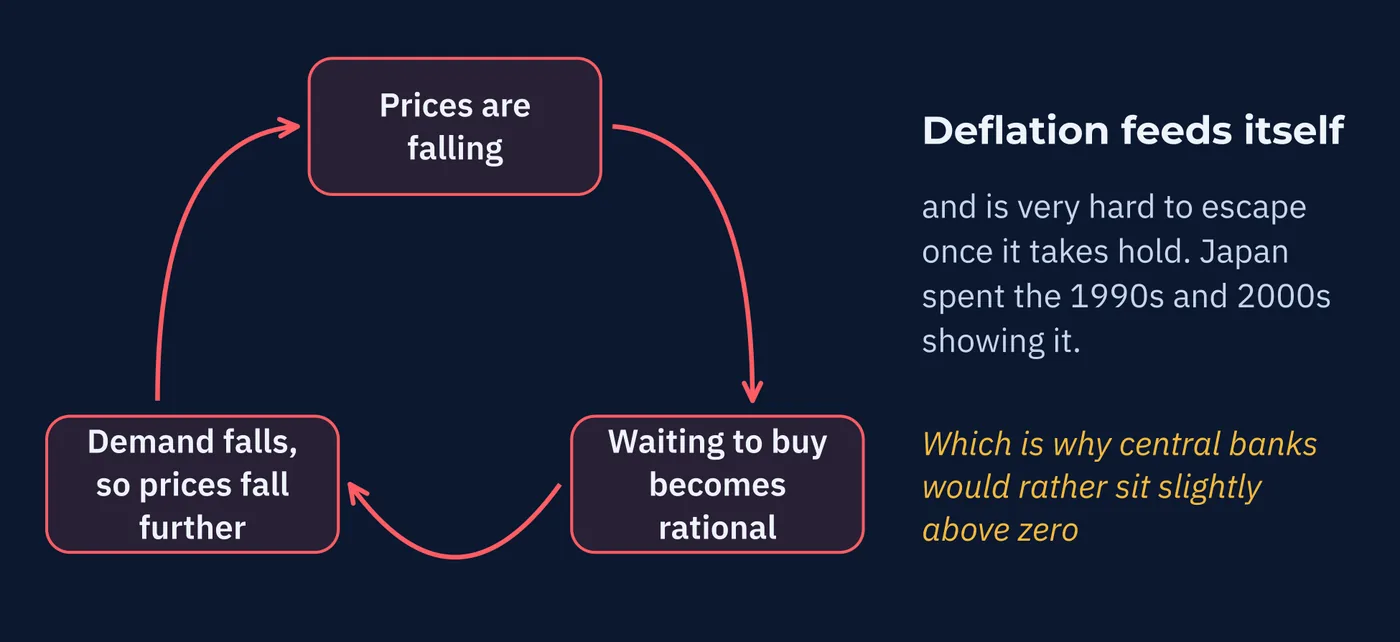
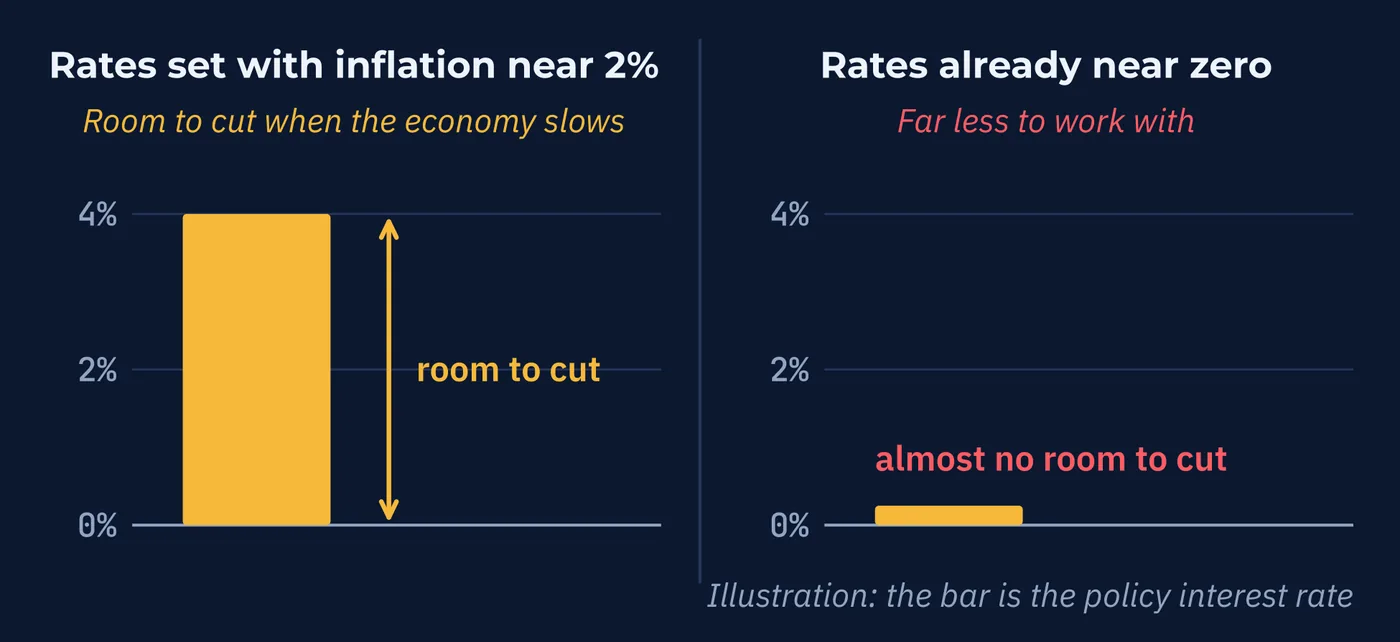
Now the third, more practical reason. Targeting two percent leaves room to cut rates when the economy slows. A bank already at zero has far less to work with when something goes wrong.
6Your Money Is Designed to Shrink
Follow that policy through and you arrive somewhere uncomfortable.
If the target is two percent and it is broadly hit, money loses value every year. Not through failure. Not through mismanagement. Not by accident.
Every fiat currency is expected to lose purchasing power. That is the design.
Here is what two percent a year actually does to a hundred dollars left alone.
| After | $100 Buys What This Buys Today |
|---|---|
| 1 year | $98 |
| 5 years | $91 |
| 10 years | $82 |
| 20 years | $67 |
| 35 years | $50 |
Thirty-five years to halve. Which is roughly one working life.
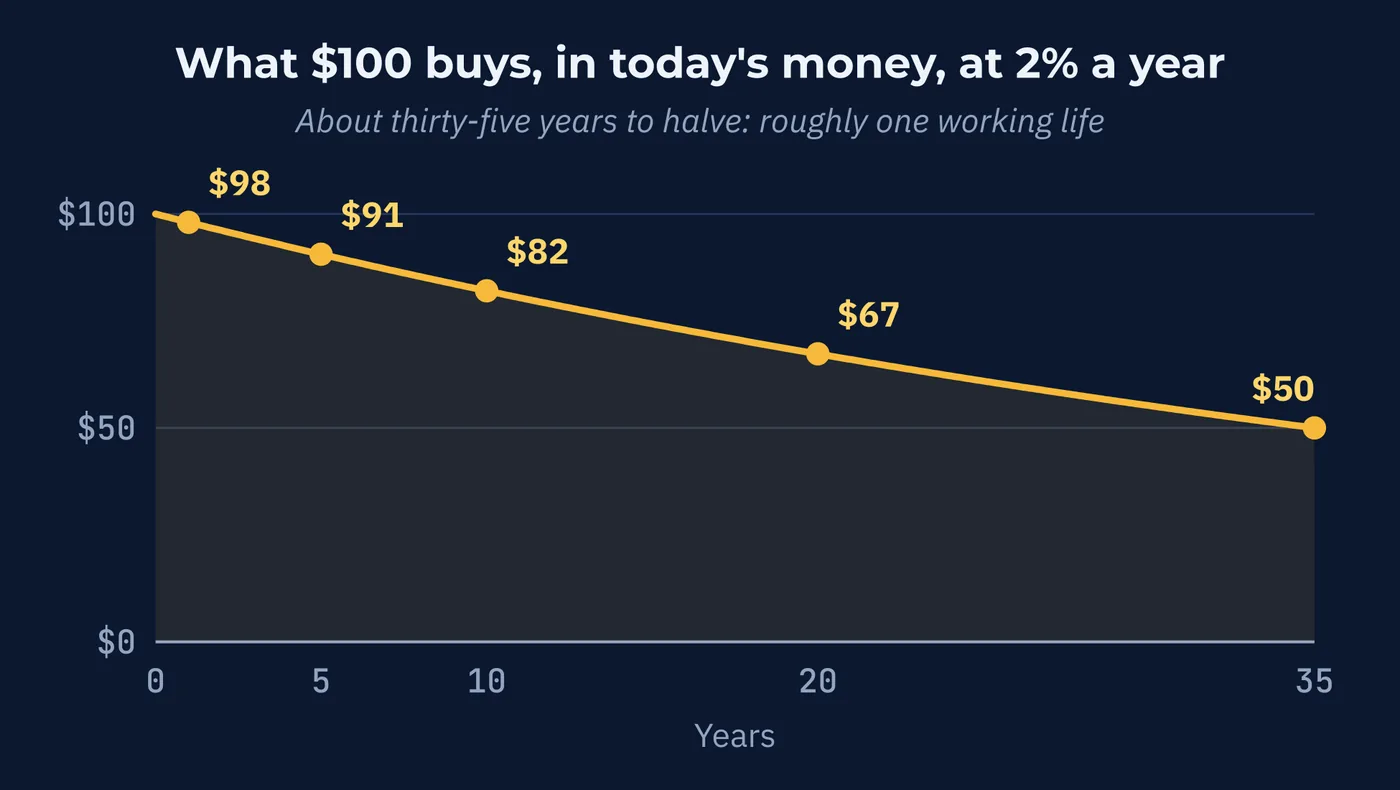
This is what purchasing power means, and it is the idea Lesson 2 set aside. A dollar is always a dollar. What a dollar buys is a different question, and it has a consistent answer over long periods.
7Why This Reaches a Chart
All of which connects back to the pair in front of you, in three ways.
The first is that money supply figures are a forward signal. When M2 grows faster than what an economy produces, more currency chases the same goods. That pushes prices up and the currency's value down, and it shows up in exchange rates.
The second is that inflation targets are why rate decisions happen at all. A central bank raising rates is usually responding to inflation above target, and Lesson 1 established what raising rates does to a currency. The target is the reason behind the reason.
The third connects to Lesson 29. Every pair compares two monetary systems, and now you can see more of what that means. Two rates of money creation. Two inflation outcomes against two targets. Two institutions with different records of hitting them.
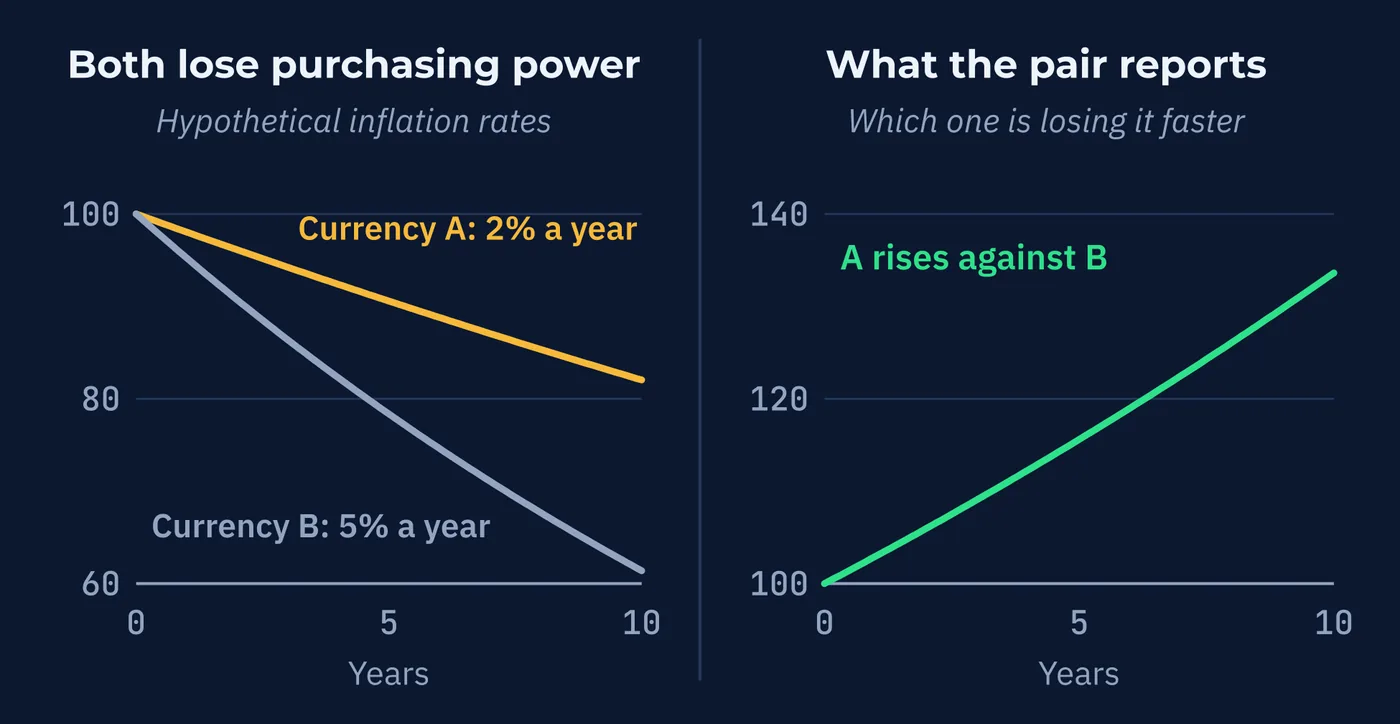
A currency pair is two rates of erosion, measured against each other.
Both currencies in any pair are losing purchasing power by design. What the exchange rate reports is which one is losing it faster, and how expectations about that are shifting.
The next lesson goes back to before any of this existed, to when money was metal and the amount that could exist depended on what came out of the ground.
Three Things to Remember
Try This
Fifteen minutes and a calculator. Make the erosion your own number.
Words From This Lesson
| Term | What It Means |
|---|---|
| Credit creation | The process by which commercial bank lending creates new money in the form of new deposits. |
| Monetary base | Physical currency plus bank reserves held at the central bank. Measured as M0. |
| M2 | The most widely watched broad money measure. Currency, current accounts, savings, and short-term deposits. |
| Open market operations | A central bank buying or selling assets to inject or withdraw reserves from the banking system. |
| Quantitative easing | Large-scale asset buying by a central bank to expand the monetary base, used when rate cuts have run out of room. |
| Inflation target | The rate of inflation a central bank aims for. Approximately two percent in most major economies. |
| Deflation | Falling prices. Self-reinforcing and considered considerably more dangerous than moderate inflation. |
| Purchasing power | What a unit of currency will actually buy. Falls over time by design under an inflation target. |
Test Your Knowledge
Eight questions. Answer them all before checking the key on the following pages. If a question gives you trouble, the answer key tells you which section to revisit.
- A. The central bank, through printing
- B. International institutions
- C. The government, through spending
- D. Commercial banks, through lending
- A. It transfers money from savers to the borrower
- B. It requests the funds from the central bank
- C. It creates a new deposit, which is new money
- D. It draws down its physical cash reserves
- A. It expands
- B. It stays constant
- C. It contracts
- D. It depends on the interest rate
- A. M0
- B. M2
- C. M1
- D. M3
- A. Inflationary pressure
- B. A deflationary warning and likely economic stress
- C. A stronger currency, reliably
- D. Nothing meaningful
- A. It discourages hoarding and keeps a buffer above deflation
- B. Two percent is the historical average
- C. It maximizes government tax revenue
- D. It is required by international agreement
- A. About 10 years
- B. About 20 years
- C. About 70 years
- D. About 35 years
- A. Which is losing it faster, and how expectations are shifting
- B. Which one is not losing value
- C. That one of them must be gaining value
- D. Nothing, since inflation does not affect exchange rates
Answer Key
Each answer explains why the correct choice is correct, why the others are not, and where to reread.
Question 1 · correct answer D
The majority of money in circulation is created by commercial banks extending loans. Central banks confirm this in their own published research.
A describes the model most people carry, which accounts for only the monetary base. C describes fiscal activity, which spends money rather than creating it. B is wrong because no international body creates a country's money supply.
Review: Section 1, The Model Most People Carry
Question 2 · correct answer C
The bank creates a deposit in the borrower's account. That deposit did not exist beforehand and was not taken from anywhere, so the money supply grows.
A is the intuitive assumption and the one this section corrects. B is wrong because the loan does not require central bank funds. D is wrong because almost none of this involves physical cash.
Review: Section 2, Every Loan Creates a Deposit
Question 3 · correct answer C
Repayment extinguishes money rather than passing it along. If repayment outpaces new lending, the supply shrinks.
A describes the opposite situation, when lending outpaces repayment. B treats the supply as fixed, which it is not. D confuses a driver of lending with the outcome itself.
Review: Section 2, Every Loan Creates a Deposit
Question 4 · correct answer B
M2 is the most widely tracked broad measure in the United States and most major economies. When commentary refers to money supply without specifying, it usually means M2.
A is the narrowest and the only one directly controlled, but not the most watched. C excludes savings and short-term deposits. D is the widest, and the Federal Reserve stopped publishing it in 2006.
Review: Section 4, Measuring the Money
Question 5 · correct answer B
A shrinking money supply signals credit tightening and is treated as a deflationary warning, usually alongside economic stress.
A describes rapid M2 growth, the opposite case. C overstates it, since currency effects depend on what other economies are doing at the same time. D is wrong because M2 is watched precisely for its signaling value.
Review: Section 4, Measuring the Money
Question 6 · correct answer A
Mild inflation gently discourages sitting on cash, and a positive target keeps distance from deflation, which is self-reinforcing and hard to escape.
B confuses an outcome with a reason. C describes an effect some argue about but not the stated purpose. D invents an agreement that does not exist, though the target is widely shared.
Review: Section 5, Why Two Percent
Question 7 · correct answer D
At two percent a year, purchasing power halves in about thirty-five years. Roughly one working life.
A and B are considerably too fast at this rate. C would correspond to an inflation rate around one percent.
Review: Section 6, Your Money Is Designed to Shrink
Question 8 · correct answer A
Both currencies in a pair lose purchasing power by design. The exchange rate reports which is losing it faster, and how expectations about that are changing.
B is wrong because under an inflation target both are losing value. C misreads a relative measure as an absolute one. D is wrong because inflation differences are among the strongest drivers of currency movement.
Review: Section 7, Why This Reaches a Chart
Keep going
Where Money Came From is written by Kanin D. Alldredge for The Currency Classroom, and it is free to read. There is more free from CNS: start here.
Start free with CNS →