What a Single Candle Tells You

1A Summary, Not a Story
Candle charts are traditionally traced to Japanese rice trading, centuries before anyone traded currencies on a screen. Much of the credit goes to Munehisa Homma, a rice merchant from Sakata who traded in Osaka in the 1700s. They became widely known among Western traders after Steve Nison published Japanese Candlestick Charting Techniques in 1991.
The credit to Homma is a tradition more than a record. By Nison's own account, the charts themselves probably came later, after 1850.
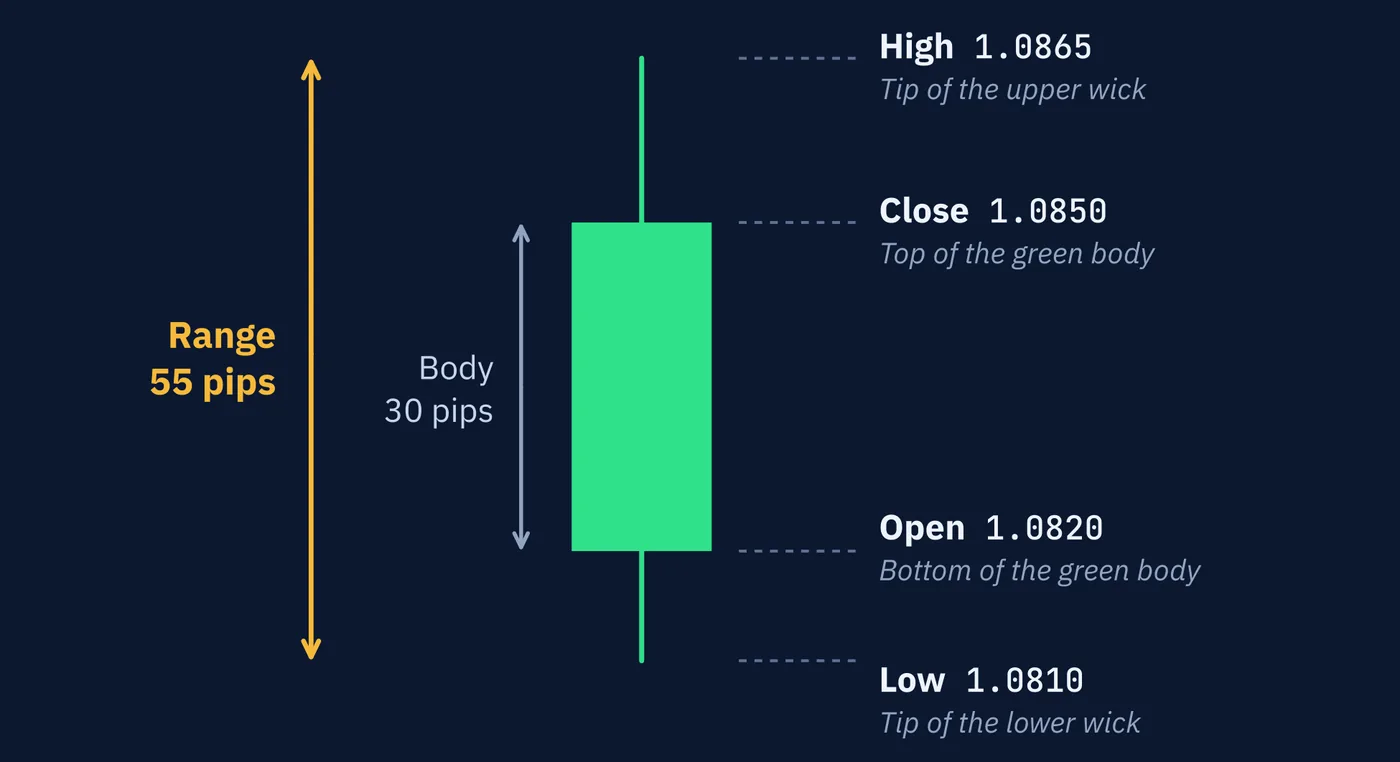
Lesson 3 used this one-hour EUR/USD candle as its worked example.
| Price | Value | Where It Sits |
|---|---|---|
| Open | 1.0820 | Bottom of the green body |
| Close | 1.0850 | Top of the green body |
| High | 1.0865 | Tip of the upper wick |
| Low | 1.0810 | Tip of the lower wick |
Four prices summarize an hour. Reading a candle well means reading how those four prices relate to each other, not just which color the body is.
The most useful measure to start with is the candle's range, the distance from high to low. Here it is 55 pips, from 1.0810 to 1.0865. Everything else in this lesson is measured against it.
A few more words before going on. Older books call the body the real body and the wicks shadows, so you will read about an upper shadow and a lower shadow. A candle that closes above its open is a bullish candle, and one that closes below its open is a bearish candle. Lesson 57 explained where bulls and bears come from.
Both words also get attached to predictions. A bullish pattern means one that traders expect to be followed by a rise. Keep the two uses apart. The first describes what happened. The second is a claim.
2The Body Against the Range
A body on its own says how far price traveled from open to close. Compared with the range, it says how much of the period's movement was kept.
In the example, the body is 30 pips and the range is 55, so the body is a little over half the candle. Price moved a fair amount in both directions, and the gain it held from open to close was a little over half the candle's full height.
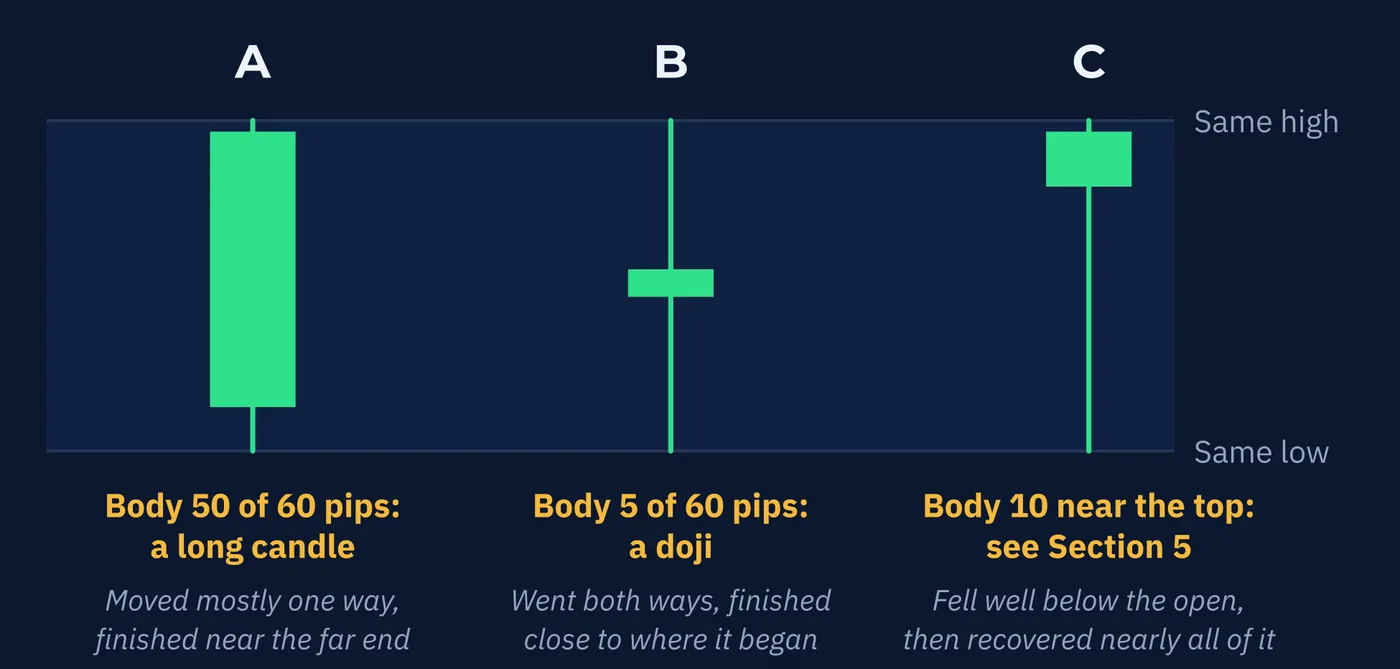
Here are three candles with the same 60-pip range.
| Candle | Body | What It Records |
|---|---|---|
| A | 50 pips, small wicks | Price moved mostly one way and finished near the far end |
| B | 5 pips, wicks on both sides | Price went both ways and finished close to where it began |
| C | 10 pips near the top, long lower wick | Price fell well below the open, then recovered nearly all of it |
Candle B has a name. A candle whose open and close are equal, or very nearly, is called a doji. It records a period in which neither side kept any ground by the close.
Candles A and C have names too. A candle like A, with a large body and small wicks, is called a long candle. It is similar to a marubozu, a candle that is all body, and where one becomes the other is a judgment call. Section 6 describes the marubozu. Candle C has two names, depending on where it appears on the chart, and Section 5 explains why.
3Where the Close Sits
Many traders treat the close as the most informative of the four prices, because it is where price was left when the period ended. Where the close sits within the range is easy to measure.
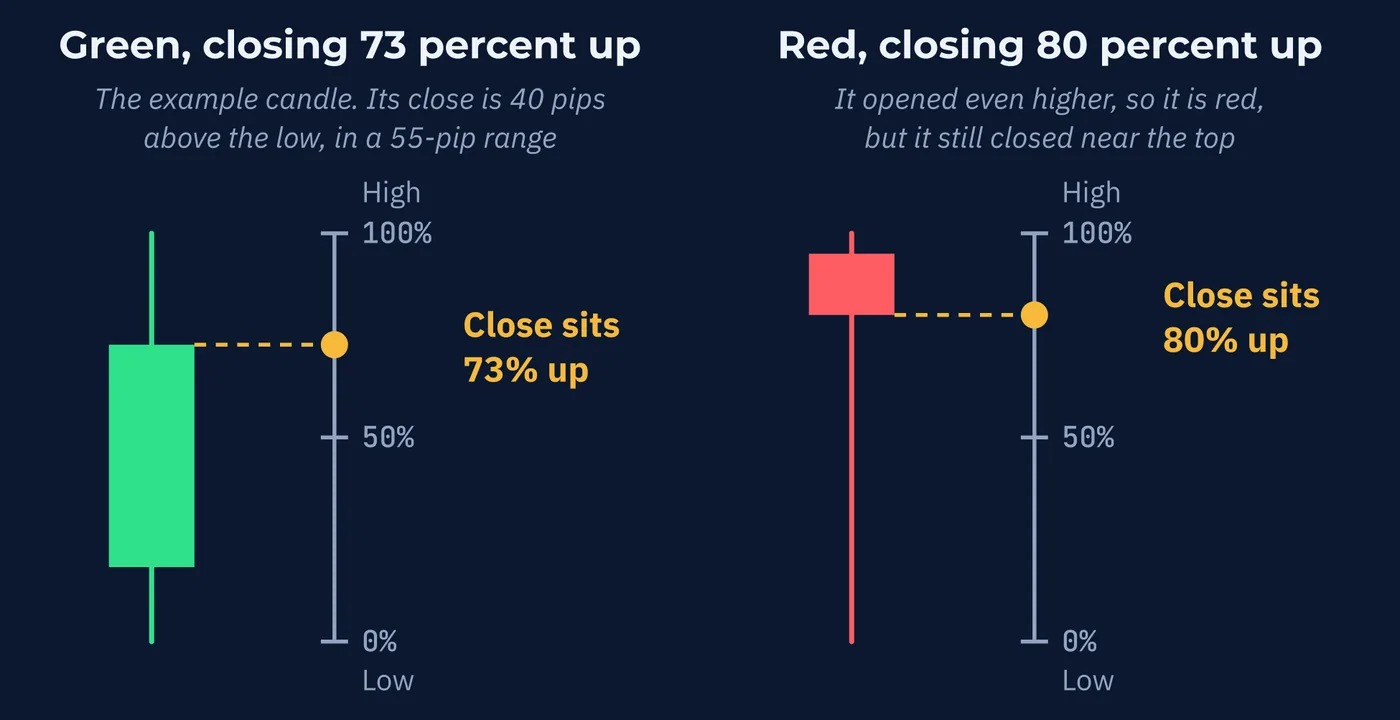
(close − low) ÷ (high − low)For the example candle, the close is 1.0850 and the low is 1.0810, so the close is 40 pips above the low. The range is 55 pips. That is 40 pips divided by 55 pips, or about 73 percent. The close sits nearly three quarters of the way up the range.
The 40 pips is measured from the low, not from the open. The body, from open to close, is still 30 pips.
A close near 100 percent means price finished at the top of everything it traded during the period. A close near zero means it finished at the bottom. A close near 50 percent means it finished in the middle, whatever color the body is.
This measure is useful because it ignores the open. A red candle can still close in the upper part of its range if it opened even higher, and a green candle can close near its low if it opened lower still.
4What a Wick Records
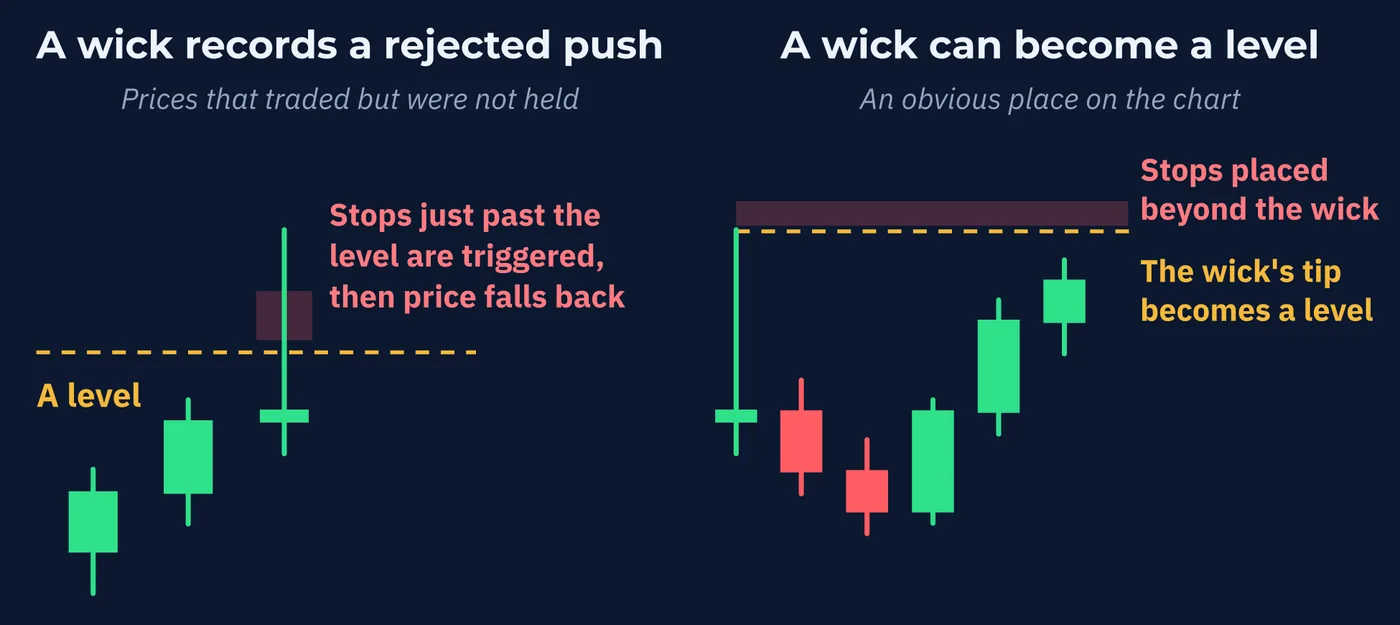
Lesson 3 said a long wick means somebody tried and did not succeed. More precisely, a wick marks prices that traded during the period but were not held at the close.
Lesson 55 explains one common way that happens. Stops sit just beyond levels. Price pushes through, triggers them, finds nobody willing to keep going, and falls back. The wick is the footprint of that push.
Wicks also tend to become levels of their own. A prominent wick is an obvious place on the chart, and many traders place their stops just beyond it. That means the kind of order clustering Lesson 55 described can build up past a wick, which can make it a target the next time price arrives.
So a wick is a record of prices that were tried and rejected, and often the starting point for the next level someone draws.
5Location Changes the Meaning
A candle on its own is a period with no context. The same shape can mean very different things depending on where it appears.
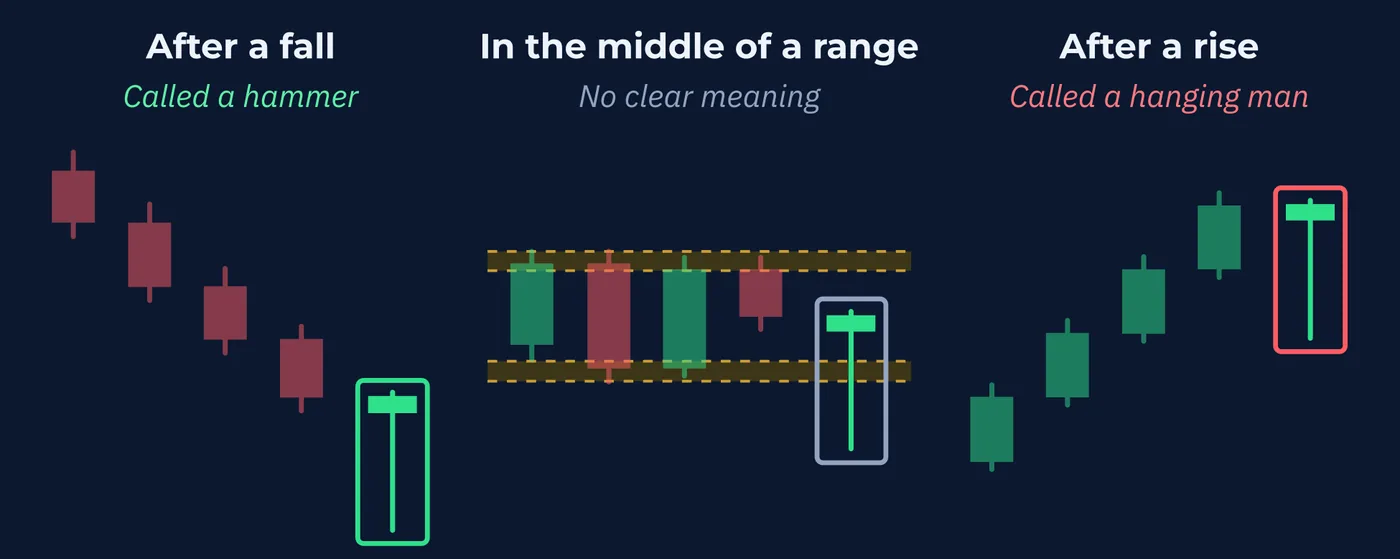
Take candle C from Section 2, a small body near the top with a long lower wick. At the bottom edge of a range, it records price dipping below support and being pushed back, which many traders read as the edge holding. In the middle of a range, the same shape records a dip that went nowhere in particular. After a long rise, it records a sharp intraday drop that was bought back, which some traders read as a warning rather than strength.
Traditional candle names follow this logic. That exact shape is called a hammer when it appears after a fall and a hanging man when it appears after a rise. Same open, high, low, and close. Different names, because the location is different.
A candle's shape tells you what happened. Its location decides what anyone thinks it means.
This is why the previous four lessons came first. Levels, trends, ranges, and disorder are the location. Without them, a candle is just four prices.
6The Named Candles
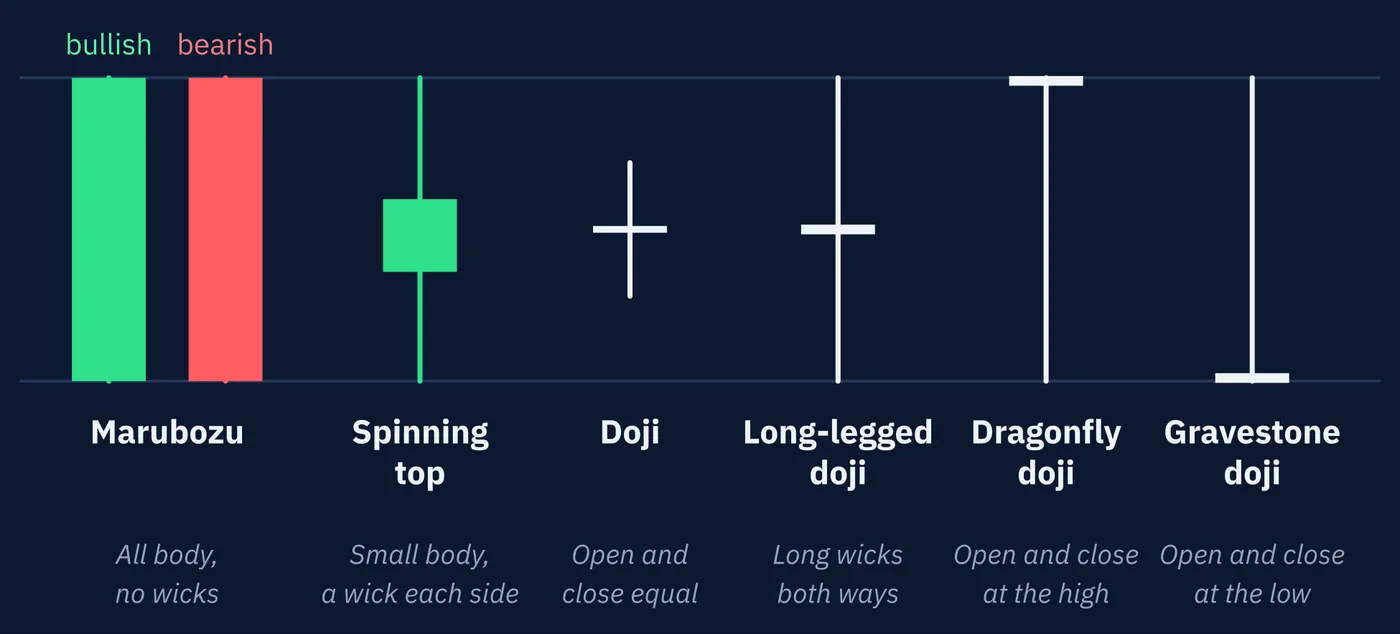
Candle reading comes with a vocabulary, and you will meet it everywhere. The names fall into three groups. Two describe shape alone. The third describes shape plus location, which is the point Section 5 just made.
All body. A marubozu has no wicks, or almost none. A green one opened at its low and closed at its high, so the body is the whole range. A red one did the opposite.
Small body, a wick on each side. A spinning top has a small body with a wick above and a wick below, each longer than the body. A doji, from Section 2, is the extreme case, with almost no body at all. Dojis are sorted by where the open and close sit.
| Name | Where the Open and Close Sit | What It Records |
|---|---|---|
| Long-legged doji | Near the middle, with a long wick each way | Price traveled far in both directions and finished where it started |
| Dragonfly doji | At the high, with one long lower wick | Price fell, then won everything back by the close |
| Gravestone doji | At the low, with one long upper wick | Price rose, then gave everything back by the close |
Small body at one end, one long wick. By the usual rule of thumb the wick is at least twice as long as the body, and there is little or no wick at the other end. There are two shapes and four names.
| Shape | After a Fall | After a Rise |
|---|---|---|
| Long lower wick, body at the top | Hammer | Hanging man |
| Long upper wick, body at the bottom | Inverted hammer | Shooting star |
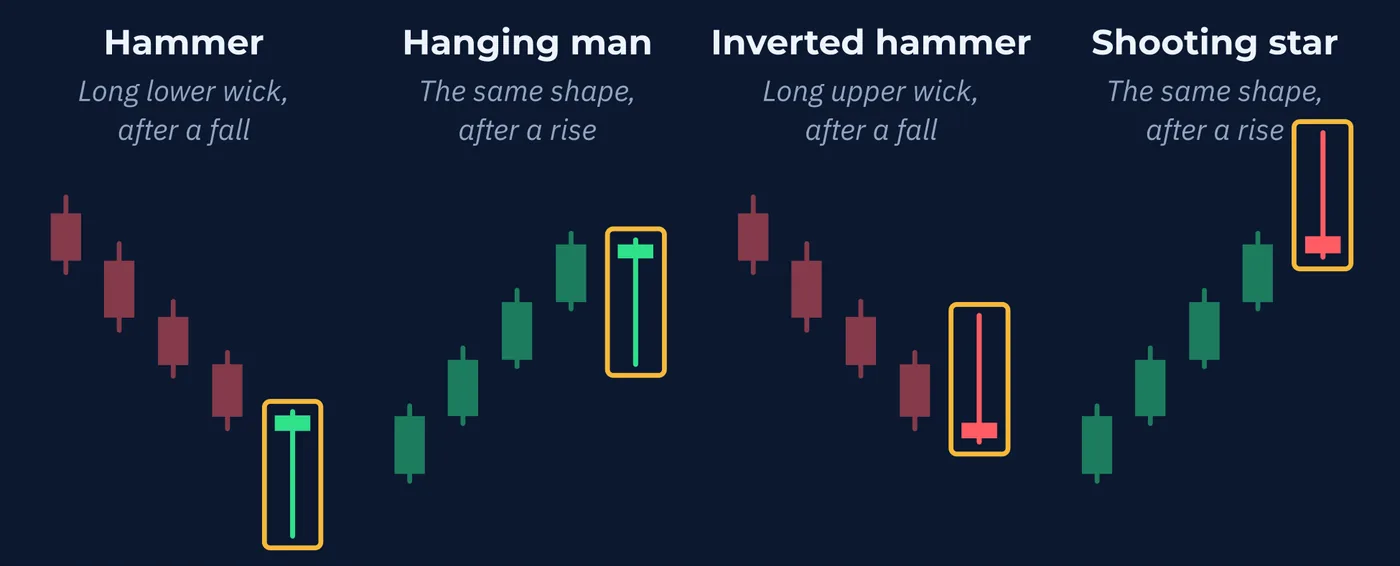
The body can be either color. Many traders skip the four names and call any candle of this kind a pin bar.
Nothing about the candle itself separates a hammer from a hanging man, or an inverted hammer from a shooting star. The name is decided by what came before it.
7Naming a Candle From Its Prices
The measures from Sections 2 and 3 are enough to name most candles without a picture. Here are five illustrative one-hour EUR/USD candles.
| Candle | Open | High | Low | Close |
|---|---|---|---|---|
| 1 | 1.0800 | 1.0862 | 1.0798 | 1.0860 |
| 2 | 1.0850 | 1.0880 | 1.0820 | 1.0852 |
| 3 | 1.0832 | 1.0846 | 1.0790 | 1.0842 |
| 4 | 1.0818 | 1.0862 | 1.0806 | 1.0810 |
| 5 | 1.0830 | 1.0858 | 1.0806 | 1.0842 |
| Work out the range, the body as a share of the range, and where the close sits. The name follows. | ||||
| Candle Range | Body | Close Sits At | Name | |
| 1 64 pips | 60 pips, 94 percent | 97 percent | Marubozu, near enough | |
| 2 60 pips | 2 pips, 3 percent | 53 percent | Long-legged doji | |
| 3 56 pips | 10 pips, 18 percent | 93 percent | Hammer or hanging man | |
| 4 56 pips | 8 pips, 14 percent | 7 percent | Inverted hammer or shooting star | |
| 5 52 pips | 12 pips, 23 percent | 69 percent | Spinning top |
| Candle | Range | Body | Close Sits At | Name |
|---|---|---|---|---|
| 1 | 64 pips | 60 pips, 94 percent | 97 percent | Marubozu, near enough |
| 2 | 60 pips | 2 pips, 3 percent | 53 percent | Long-legged doji |
| 3 | 56 pips | 10 pips, 18 percent | 93 percent | Hammer or hanging man |
| 4 | 56 pips | 8 pips, 14 percent | 7 percent | Inverted hammer or shooting star |
| 5 | 52 pips | 12 pips, 23 percent | 69 percent | Spinning top |
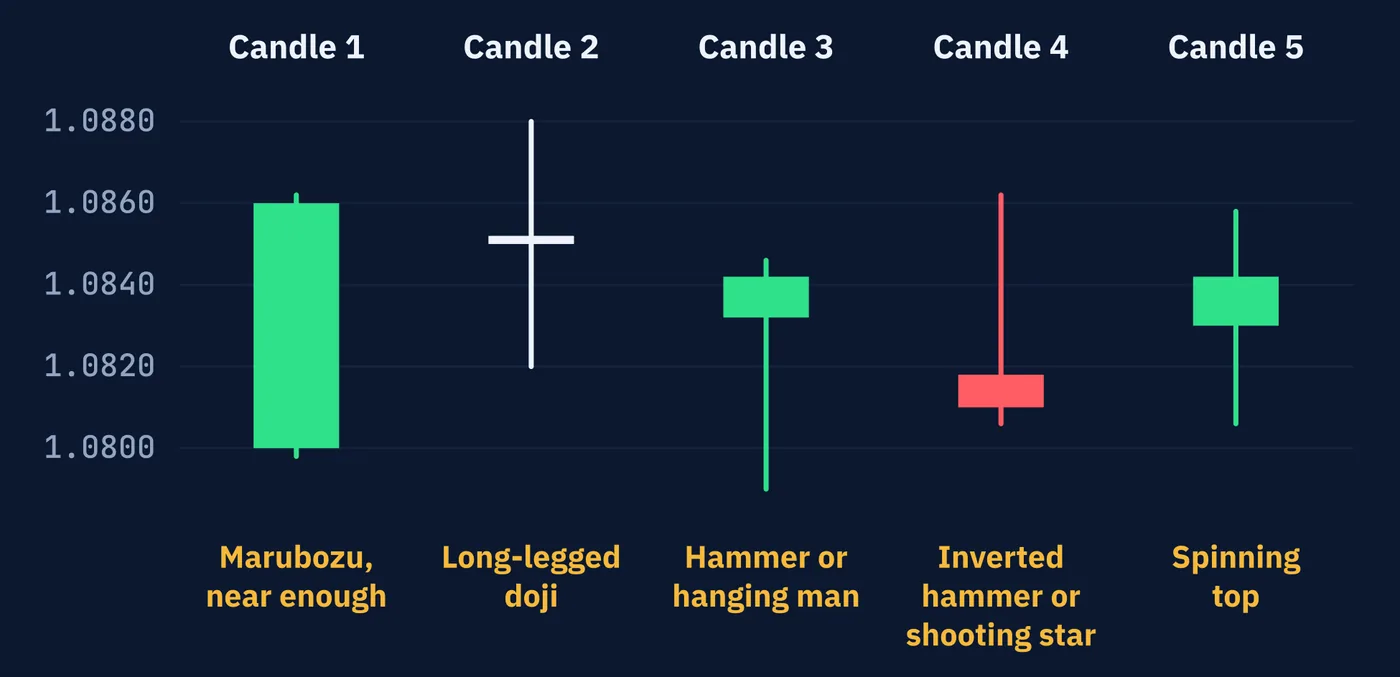
Candle 1 is 94 percent body. Candle 2 has almost no body and closes near the middle. Candles 3 and 4 have small bodies at one end and a single wick more than four times as long as the body, so their names wait on location. Candle 5 has a small body with a longer wick on each side.
Real candles rarely match a textbook shape exactly, which is why near enough appears in the table. How near is near enough is another tolerance, like the one in Lesson 58. Set it before you look.
8Patterns Built From Several Candles
The names do not stop at one candle. The best-known patterns use two or three in a row. They are named here so that you can follow a conversation, and they are taught in the Candlesticks course.
Two cautions come first. Several traditional definitions call for a gap between one candle and the next. Currency candles rarely gap except over a weekend, so currency traders use looser versions, and they do not all use the same one.
And every pattern carries the rule from Section 5. The same candles that earn a name after a long rise are nothing in particular in the middle of a range.
Most patterns come as a pair. The bullish version is looked for after a fall, and the bearish version is its mirror image, looked for after a rise.
| Bullish Version | Bearish Version | Candles | What It Looks Like |
|---|---|---|---|
| Bullish engulfing | Bearish engulfing | Two | The second body is the opposite color and covers the whole first body |
| Bullish harami | Bearish harami | Two | The reverse. A small second body sits inside the first body |
| Tweezer bottom | Tweezer top | Two | Two candles with the same low, or the same high |
| Piercing line | Dark cloud cover | Two | The second candle opens beyond the end of the first and closes past the middle of its body |
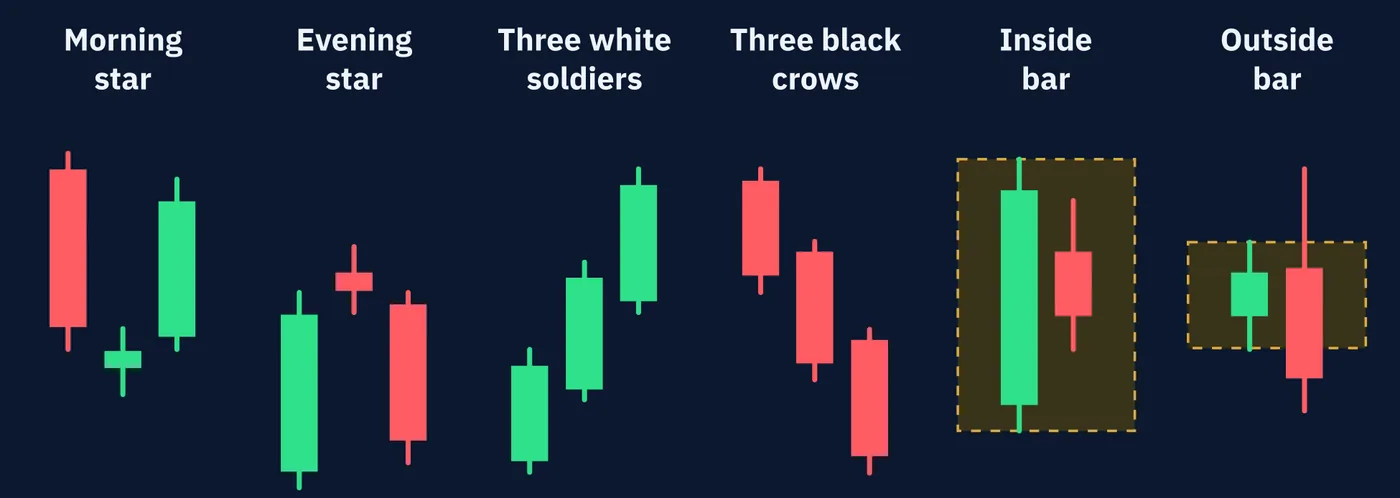
| Morning star | Evening star | Three | A long candle, a small one, then a long one the other way |
| Three white soldiers | Three black crows | Three | Three long candles in a row, all the same color |
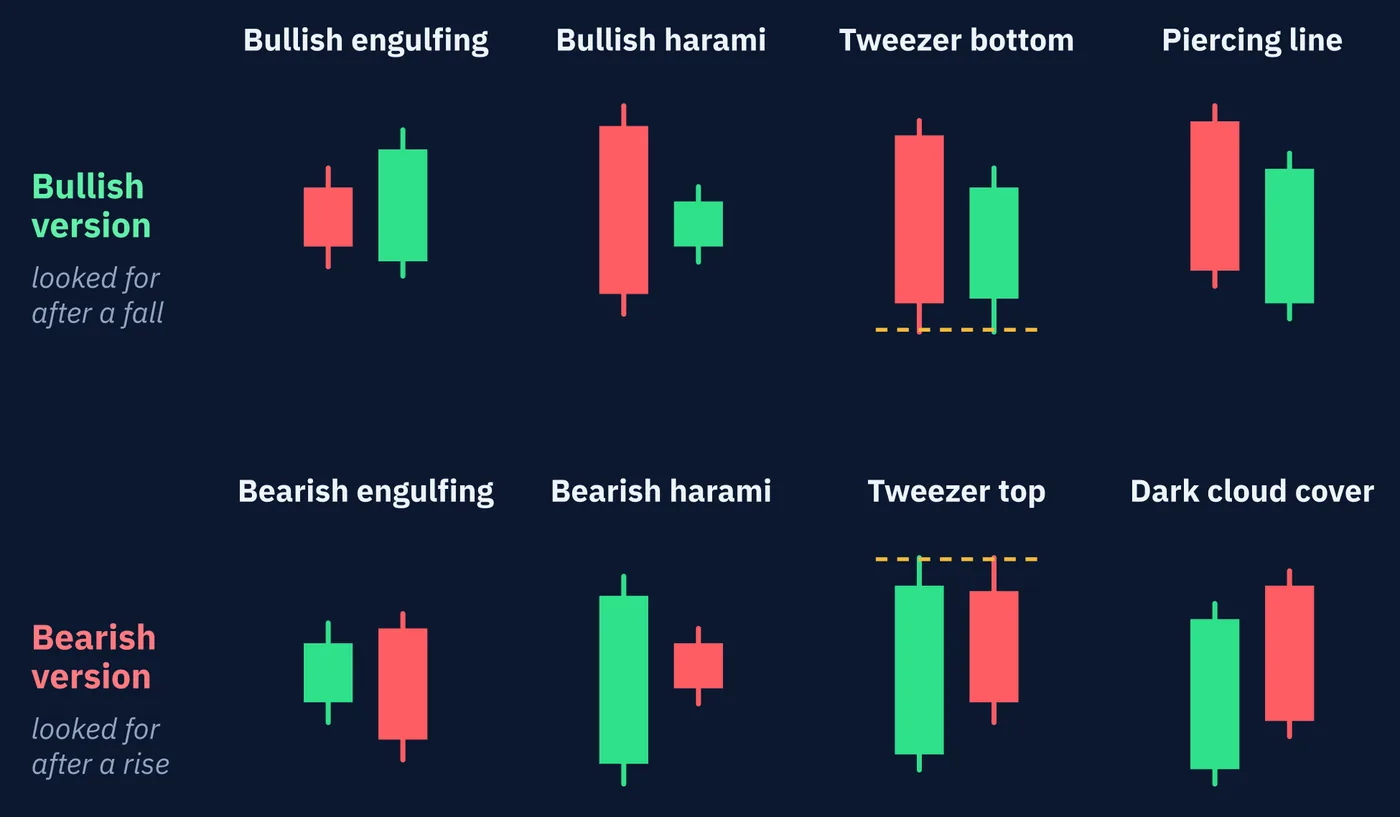
In the bullish engulfing pattern, a green body covers the red body before it. In the bearish one, a red body covers a green one. As Section 1 said, the word in front is a claim about what comes next. It is not a description of the candles.
Chart books file every pattern in the table as a reversal pattern, meaning one that is expected to mark a change of direction. That is the claim Section 11 looks at.
White and black in the last row are leftovers. Lesson 3 mentioned that older charts drew rising candles hollow and falling candles filled, so three white soldiers are three rising candles and three black crows are three falling ones.
Two more names come from Western charting, and they compare whole candles, wicks included. An inside bar is a candle whose high and low both sit inside the range of the candle before it. An outside bar reaches past the candle before it at both ends. They look like a harami and an engulfing pattern, but those two compare bodies only.
compared.
9What a Candle Hides
A candle keeps four prices from a period and throws away everything else. Two very different hours can produce the identical candle.
| Path One | Path Two | |
|---|---|---|
| First | Price dips from 1.0820 to the low at 1.0810 | Price rallies from 1.0820 to the high at 1.0865 |
| Then | It rallies to the high at 1.0865 | It falls all the way to the low at 1.0810 |
| Finally | It eases back to close at 1.0850 | It recovers to close at 1.0850 |
Path one is a steady climb with a small dip at the start. Path two is a sharp rally, a collapse of more than 50 pips, and a recovery. Traders living through those two hours would have had very different experiences. The candle is the same.
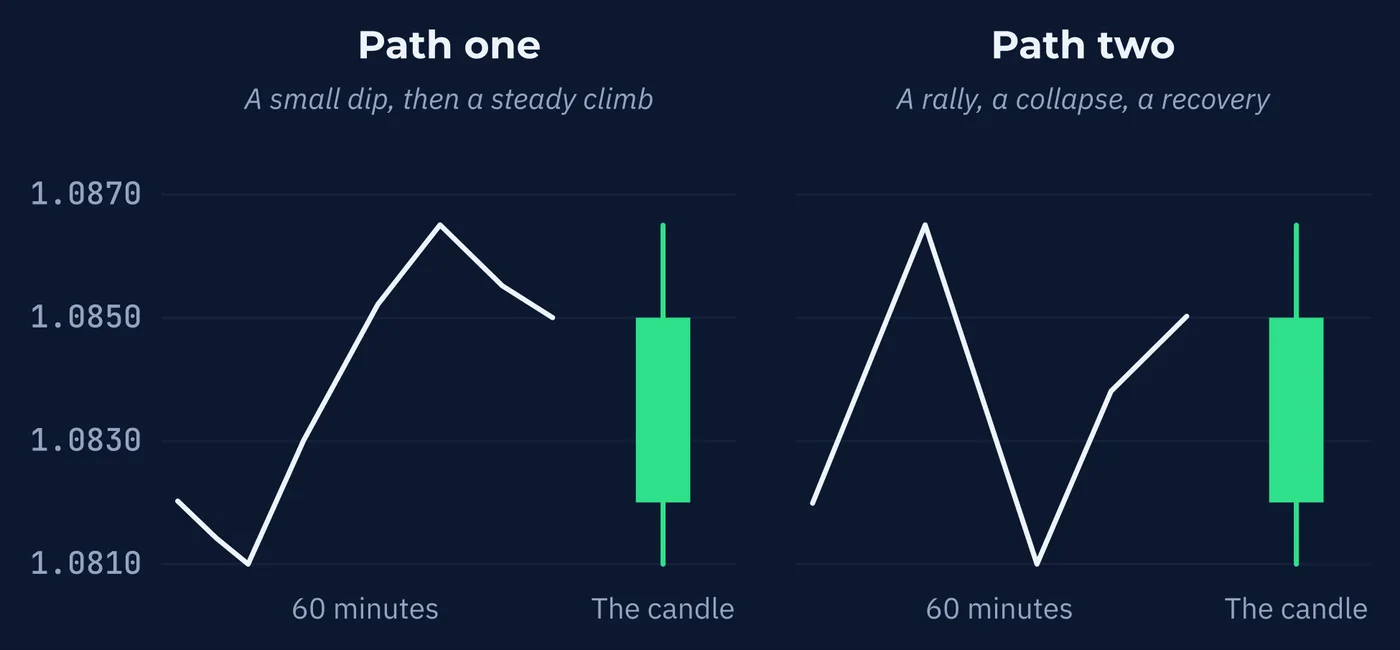
Switching to a shorter timeframe shows the path, as Lesson 3 described. Within a single candle, the order of events is simply gone.
Many platforms also show a volume bar under each candle. In spot currencies, where Lesson 40 explained there is no central exchange, that bar is usually a count of price changes at one provider, not the amount actually traded across the market.
10Your Candle May Not Be Their Candle
Two traders looking at the same pair on the same day can see different candles. Three things decide it.
The price feed. Lesson 40 explained that there is no official price, so different providers record slightly different highs and lows. Lesson 14 explained that most charts draw only the bid, so a wick on your chart may not be a price anyone could have bought at.
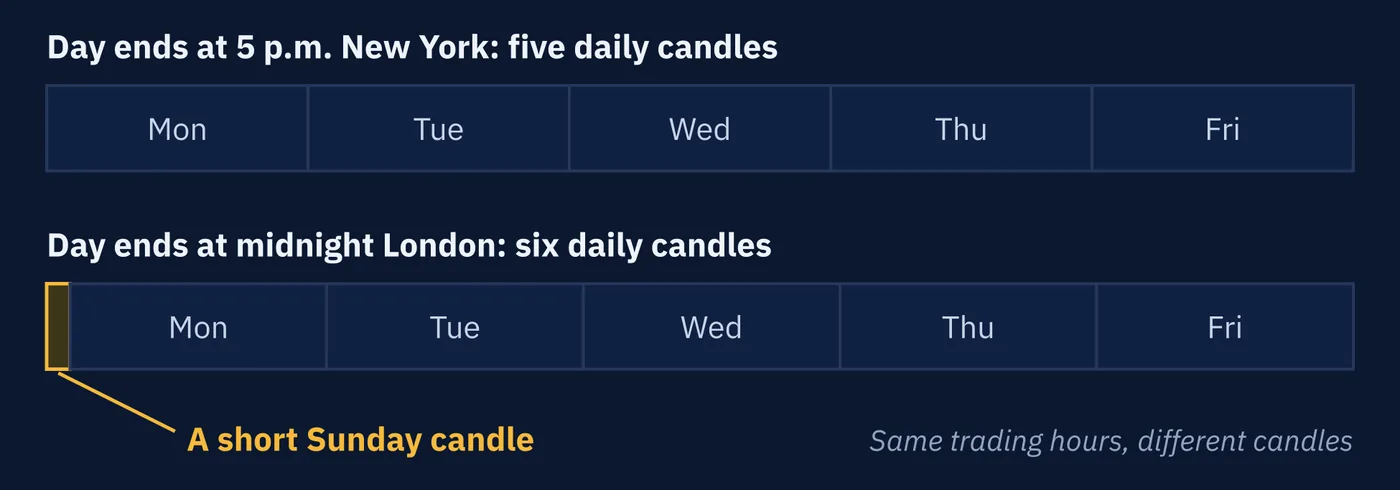
When the period starts and ends. A daily candle needs a moment when the day begins. Many forex platforms end the day at 5 p.m. New York time, which gives five daily candles a week. A platform that ends the day at midnight in London also produces a short extra candle for Sunday evening, and every daily candle it draws covers a different stretch of time.
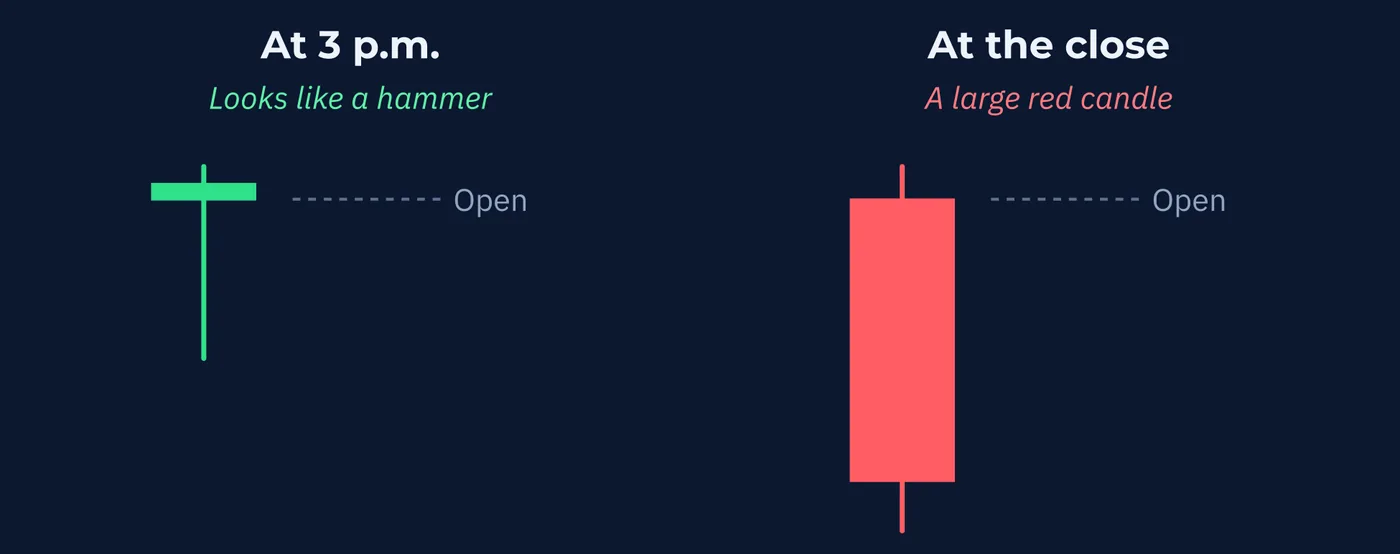
Whether the candle is finished. Lesson 3 pointed out that the candle at the right edge is still forming. A hammer at 3 p.m. can be a large red candle by the close. Any reading of a candle before its period ends is a reading of a candle that does not exist yet.
11What the Research Says
Candle reading has been tested, mostly on stock markets, and the results are mixed.
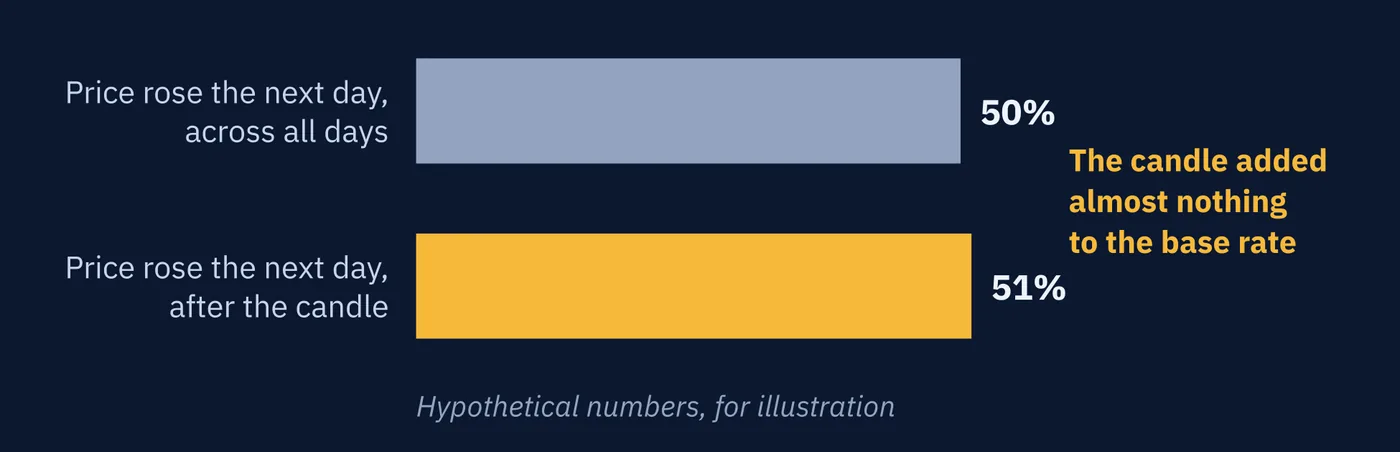
A widely cited study by Ben Marshall, Martin Young, and Lawrence Rose tested 28 candle signals, single candles and short patterns, on the stocks in the Dow Jones Industrial Average from 1992 to 2002. Using careful statistical tests, they found no evidence that any of the signals predicted the next move.
Critics replied that the tests ignored location, the very thing Section 5 describes, and that candles cannot be judged without the trend around them. Later work on the same stocks found that some three-candle reversal patterns were profitable after costs, depending mainly on how long the trades were held. The honest summary is that single candles alone show little evidence of an edge, and the debate over context is not settled.
One candle covers one period on one timeframe. The next lesson looks at what happens when you read several timeframes at once.
Three Things to Remember
Try This
Twenty-five minutes with a daily and an hourly chart.
Words From This Lesson
| Term | What It Means |
|---|---|
| Range of a candle | The distance from a candle's high to its low. |
| Shadow | Another word for a wick. Older books also call the body the real body. |
| Bullish, bearish | A bullish candle closes above its open and a bearish candle closes below it. Attached to a pattern, the words are a claim about what comes next. |
| Close location | Where the close sits within the candle's range, from the low at zero to the high at 100 percent. |
| Doji | A candle whose open and close are equal or very nearly equal. |
| Long candle | A candle with a large body and small wicks. |
| Long-legged, dragonfly, gravestone doji | A doji with long wicks both ways, with one long lower wick, or with one long upper wick. |
| Marubozu | A candle that is all body, with no wicks or almost none. |
| Spinning top | A small body with a longer wick above and below. |
| Hammer | A small body near the top of the range with a long lower wick, appearing after a fall. |
| Hanging man | The same shape as a hammer, appearing after a rise. |
| Inverted hammer | A small body near the bottom of the range with a long upper wick, appearing after a fall. |
| Shooting star | The same shape as an inverted hammer, appearing after a rise. |
| Pin bar | A common name for any candle with a small body and one long wick. |
| Engulfing, harami | Two-candle patterns. In an engulfing pattern the second body covers the first. In a harami it sits inside it. |
| Reversal pattern | A pattern that chart books expect to mark a change of direction. |
| Inside bar, outside bar | A candle whose whole range sits inside the previous candle's range, or reaches past it at both ends. |
| Tick volume | A count of price changes at one provider, often shown in place of traded volume in spot currencies. |
| Base rate | How often an outcome happens anyway, without any signal. The background a signal must beat. |
Test Your Knowledge
Ten questions. Answer them all before checking the key on the following pages. If a question gives you trouble, the answer key tells you which section to revisit.
- A. 55 pips
- B. 30 pips
- C. 15 pips
- D. It cannot be known without the open
- A. It has a long lower wick
- B. It is followed by a rise
- C. It closes above its open
- D. It appears after a fall
- A. 20 percent of the way up the range
- B. 80 percent of the way up the range
- C. 50 percent of the way up the range
- D. It depends on the color
- A. The spread during the period
- B. The average price of the period
- C. Prices that traded during the period but were not held at the close
- D. Prices where no trading took place
- A. The names are interchangeable
- B. The open and close differ between the two
- C. Hammers are always green
- D. Location decides what a candle is taken to mean
- A. A gravestone doji
- B. A marubozu
- C. A spinning top
- D. A dragonfly doji
- A. Engulfing
- B. Harami
- C. Morning star
- D. Tweezer top
- A. It moved the same way in both
- B. The low always came first
- C. The high always came first
- D. Nothing, because a candle does not record the order of events
- A. One of them has a broken chart
- B. Daily candles are randomly generated
- C. Their platforms may use different price feeds and end the day at different times
- D. Candles are only accurate on hourly charts
- A. The interest rate set by a central bank
- B. How often an outcome happens anyway, without any signal
- C. The lowest price of the day
- D. The spread charged on a trade
Answer Key
Each answer explains why the correct choice is correct, why the others are not, and where to reread.
Question 1 · correct answer A
The range is the distance from high to low. 1.0865 minus 1.0810 is 55 pips.
B is the body of the Lesson 3 example, not its range. C is the upper wick. D is wrong because the range uses only the high and the low.
Review: Section 1, A Summary, Not a Story
Question 2 · correct answer C
A bullish candle is one that closed above its open. The word describes what happened during the period.
B is the other use of the word, a claim about what comes next, which a single candle cannot settle. A describes a shape, and a long lower wick can belong to a candle of either color. D describes a location.
Review: Section 1, A Summary, Not a Story
Question 3 · correct answer B
The close minus the low is 80 pips, and the range is 100 pips. 80 divided by 100 is 80 percent.
A measures from the wrong end. C assumes the middle. D is wrong because the measure ignores the open, and so ignores the color.
Review: Section 3, Where the Close Sits
Question 4 · correct answer C
A wick marks prices that traded during the period but were not held when it ended.
A confuses wicks with the bid-ask gap. B is wrong because no part of a candle shows an average. D is the opposite, since the wick tips were actually traded.
Review: Section 4, What a Wick Records
Question 5 · correct answer D
The open, high, low, and close are identical. Only the location differs, and the name follows the location.
A misses that the names carry different readings. C is wrong because a hammer can be either color. B contradicts the point that the prices are the same.
Review: Section 5, Location Changes the Meaning
Question 6 · correct answer D
A doji with its open and close at the high and one long lower wick is a dragonfly doji. Price fell during the period and won everything back by the close.
A is the mirror image, with the open and close at the low. B is all body, and a doji has almost none. C has a small body with a wick on each side.
Review: Section 6, The Named Candles
Question 7 · correct answer A
In an engulfing pattern the second body is the opposite color and covers the whole of the first body.
B is the reverse, with a small second body inside the first. C uses three candles. D is two candles with the same high.
Review: Section 8, Patterns Built From Several Candles
Question 8 · correct answer D
A candle keeps four prices and discards the order in which they happened. Very different hours can produce the same shape.
A assumes the shape reveals the path. C and B each invent a fixed order that the candle does not record.
Review: Section 9, What a Candle Hides
Question 9 · correct answer C
Providers record slightly different prices, many charts show only the bid, and platforms end the trading day at different times. Each changes the candle.
A assumes one chart must be wrong, when both can be accurate. B is false. D is wrong because the same issues apply on every timeframe.
Review: Section 10, Your Candle May Not Be Their Candle
Question 10 · correct answer B
The base rate is how often an outcome happens without any signal. A signal is only useful if it beats it.
A describes a central bank rate, an unrelated use of the word. C and D describe other things entirely.
Review: Section 11, What the Research Says
Keep going
Reading Price Structure is written by Kanin D. Alldredge for The Currency Classroom, and it is free to read. There is more free from CNS: start here.
Start free with CNS →