The Three States of a Market

1Three Readings
Lesson 56 said any chart gives one of three readings. Up, down, or neither. Lesson 57 showed that the most common form of neither is a range.
But not every neither is a range. Sometimes the swings do not line up into a trend, and they do not settle between two level edges either. The chart is moving, often a lot, without any structure you can describe cleanly.
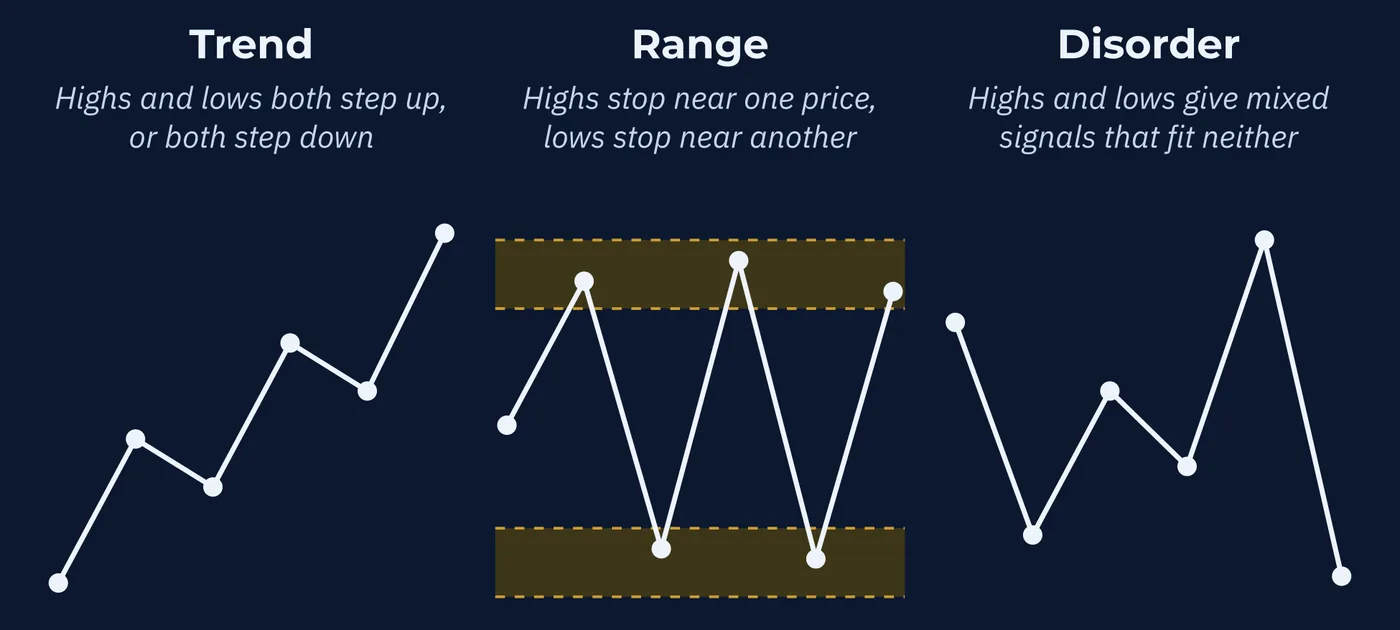
This course calls that third state disorder. It goes by several names elsewhere, and Section 3 explains why this course chose this one. Put together, the three states look like this.
| State | What the Swings Do | How It Looks |
|---|---|---|
| Trend | Highs and lows both step up, or both step down | Price is going somewhere |
| Range | Highs stop near one price and lows stop near another | Price is going back and forth between two edges |
| Disorder | Highs and lows give mixed signals that fit neither pattern | Price is moving without a shape |
Trends were split into up and down in Lesson 56. Here they count as one state, because the structure is the same in either direction.
2The Unclear Middle
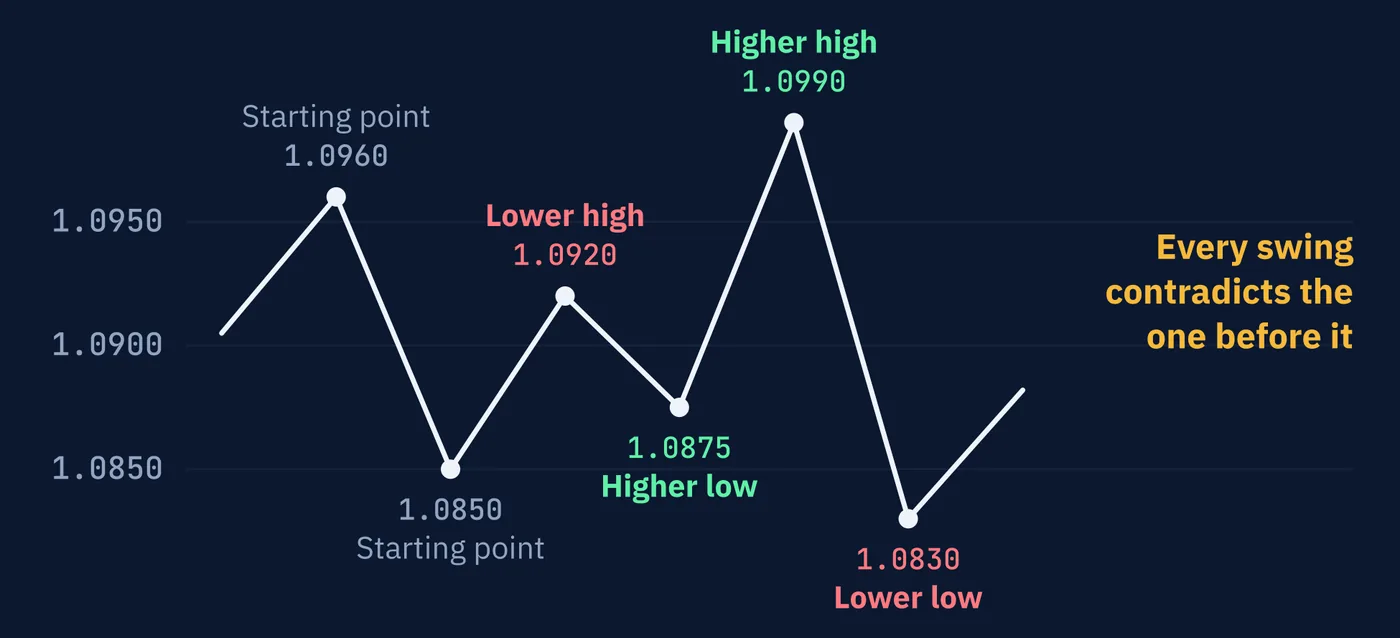
Here is what disorder can look like on an illustrative EUR/USD chart.
| Turning Point | Price | Compared With the Last One |
|---|---|---|
| High | 1.0960 | Starting point |
| Low | 1.0850 | Starting point |
| High | 1.0920 | Lower high |
| Low | 1.0875 | Higher low |
| High | 1.0990 | Higher high |
| Low | 1.0830 | Lower low |
Read it with the definitions from the last two lessons. A lower high hints at a downtrend. A higher low says it may not be one. A new high above 1.0960 looks like an uptrend, and then a new low below 1.0850 says it is not. The edges are not level enough to call it a range either.
Every swing contradicts the one before it. That is the signature of disorder. It often comes with wide swings and failed breaks in both directions, as buyers and sellers each push and neither side holds the ground it takes.
3Why It Needs a Name, and Why This One
Most charting advice offers two choices. The market is trending or it is ranging. That framing creates a quiet pressure to force every chart into one box or the other.
The table in Section 2 does not belong in either box. Calling it a trend means ignoring the lower low. Calling it a range means ignoring how far apart the highs are. Both readings require looking away from part of the chart.
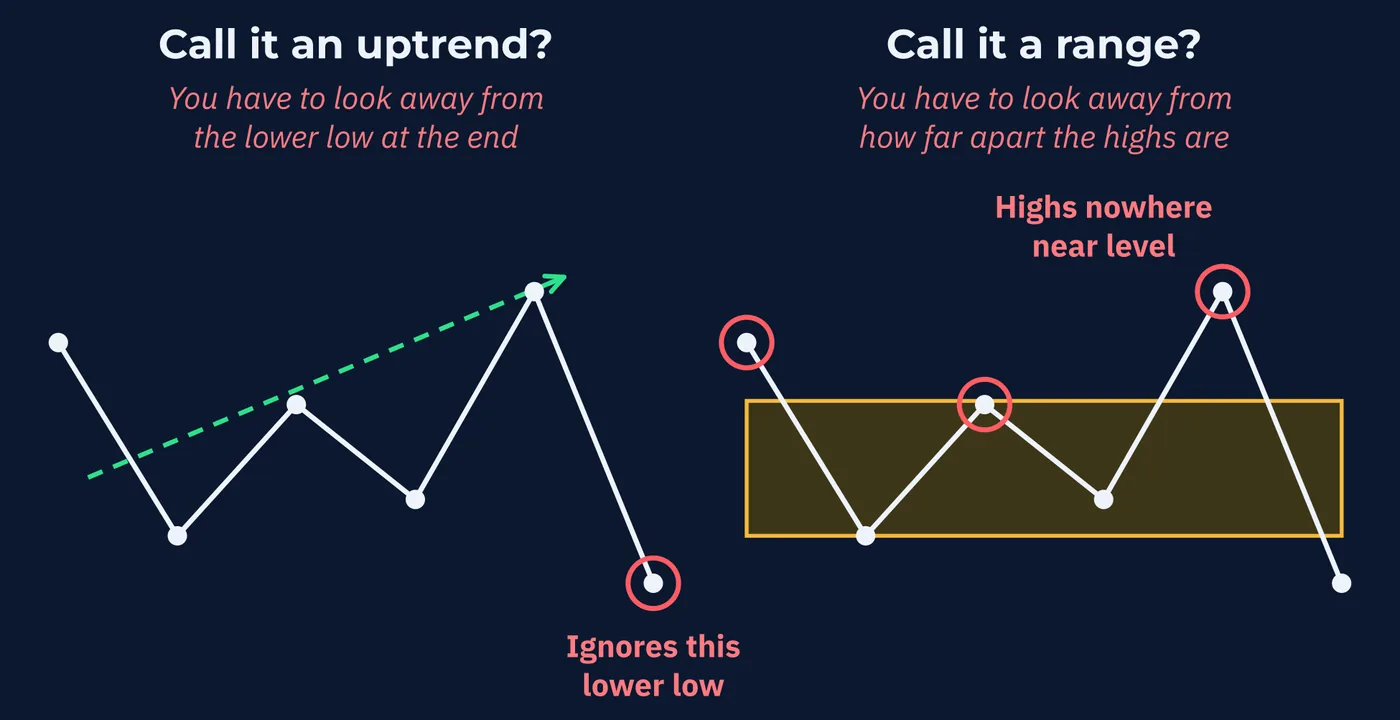
Naming the third state makes room for an honest answer. Sometimes the most accurate reading of a chart is that it does not have one yet.
That answer is not a failure to read the chart. It is a reading, and on some charts it is the only correct one.
There is no standard name for this state. You will meet several, and they do not all mean the same thing.
| Name | Where You Will Hear It | How It Compares |
|---|---|---|
| Choppy | Traders everywhere, and an indicator called the Choppiness Index | The closest everyday word, but many people use it for any sideways market, clean ranges included |
| Volatile | Some broker courses | Describes how much price is moving rather than the shape of the swings |
| Sideways volatile | The trading author Van Tharp, whose market types combine direction with activity | A close match, but it also builds in activity |
| Topping or distribution | Stan Weinstein's stage analysis and the Wyckoff model in Section 6 | Covers only the messy stretch where a trend ends, not disorder anywhere else |
This course uses disorder for three reasons.
It means one thing. Disorder is swings that contradict each other. It does not stretch to cover a quiet range, the way choppy often does.
It describes shape, not speed. A disordered market can be busy or quiet. Keeping speed out of the name keeps it separate from the second dial in Section 9, which volatile does not.
It is the opposite of structure. This series is about reading price structure. Trends and ranges are structure. Disorder is what a chart looks like when structure is missing.
When you hear choppy elsewhere, check what the speaker means. It may be this state, or it may simply be a range.
4How to Classify a Chart
The three definitions can be turned into a routine. Here is one way to do it, in five steps. It is a convention, not the only one. Its value is that it gives the same answer every time you use it.
Step 1. Fix the chart. Choose the timeframe and how far back you will look, and make them part of the answer. Uptrend means little. Uptrend on the daily chart over three months means something.
Step 2. Mark the swings. Use one rule, such as the two-candles-on-each-side rule from Lesson 56. List the last three swing highs and the last three swing lows.
Step 3. Set a tolerance. Decide how close two prices must be to count as about the same. A simple choice is the width of the zones you draw, from Lesson 55. Fix the number before you compare anything.
Step 4. Compare and label. Label the second and third highs as higher, lower, or about the same as the high before. Do the same for the lows. That gives two labels for the highs and two for the lows.
Step 5. Read the labels. The table below turns the four labels into a reading.
| What the Labels Say | Reading |
|---|---|
| Both highs higher and both lows higher | Uptrend |
| Both highs lower and both lows lower | Downtrend |
| All four about the same | Range |
| The edges closing in on each other | Range, narrowing. One of the triangles from Lesson 57 |
| Anything else | Disorder |
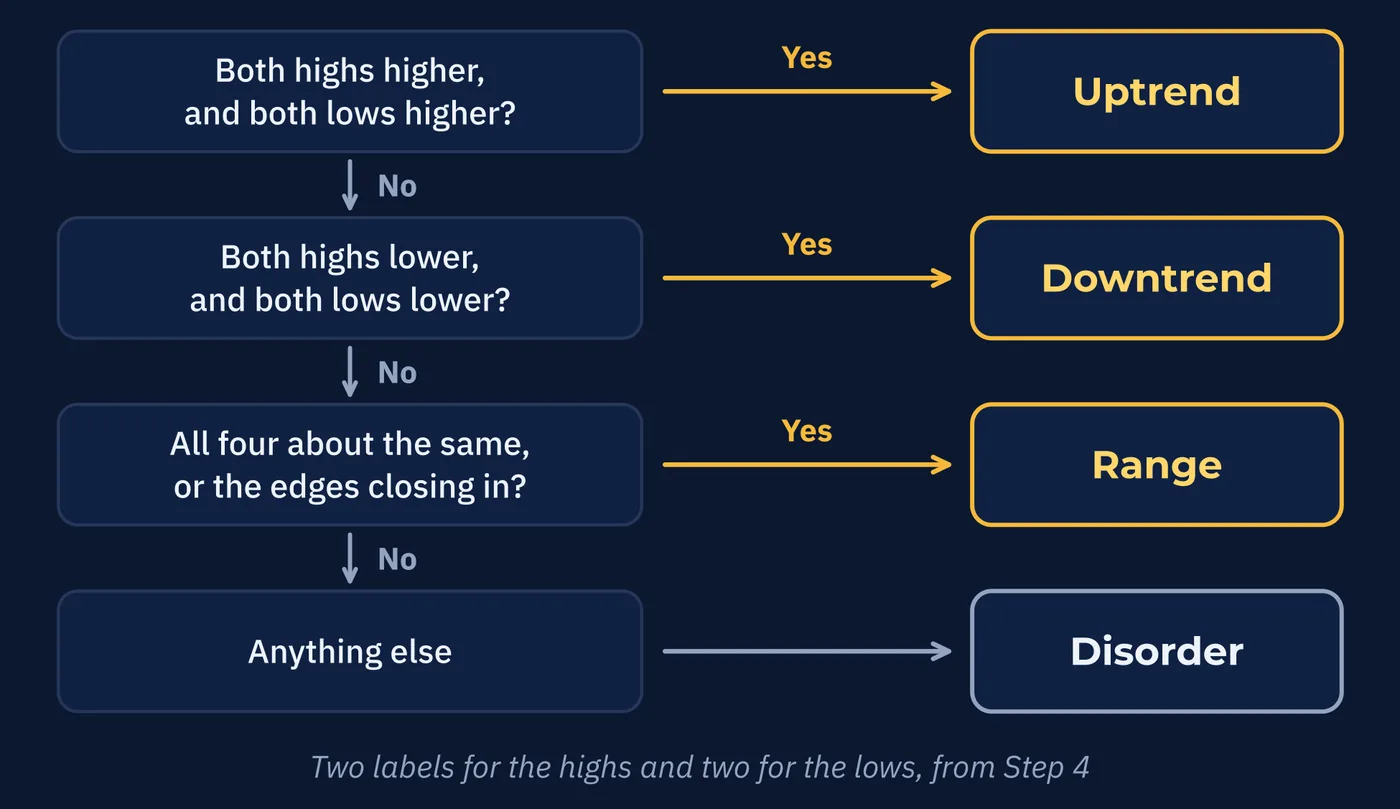
Two labels on each side is the minimum. One higher high is not a trend, which is why the routine needs three highs and three lows before it will say anything.
Finish by recording the price that would change the reading. For an uptrend it is the last higher low. For a range it is the two edges. For disorder it is whatever the next swing would have to do to make the labels agree.
One pattern inside anything else has a name of its own. When both highs are higher and both lows are lower, the swings are spreading apart, and chart books call it a broadening pattern. It is disorder at its plainest.
5Four Charts, Classified
Here is the routine applied to four illustrative daily charts, each covering about two months. The tolerance is 20 pips for all four.
| Chart | Highs, in Order | Lows, in Order | Reading |
|---|---|---|---|
| A USD/JPY | 148.20 149.00 149.85 | 147.10 147.90 148.70 | Uptrend |
| B USD/CAD | 1.3720 1.3712 1.3725 | 1.3610 1.3618 1.3606 | Range |
| C EUR/USD | 1.0960 1.0920 1.0990 | 1.0850 1.0875 1.0830 | Disorder |
| D NZD/USD | 0.6080 0.6105 0.6120 | 0.6010 0.6022 0.6044 | Disorder |
Chart A. Each high beats the last by 80 pips or more, and so does each low. Uptrend. The price that would change the reading is the last higher low, 148.70.
Chart B. No high is more than 13 pips from the one before it, and no low is more than 12. Range, with edges near 1.3720 and 1.3610. A close beyond either edge would change the reading.
Chart C. This is the chart from Section 2. The highs read lower, then higher. The lows read higher, then lower. The labels disagree on both sides. Disorder.
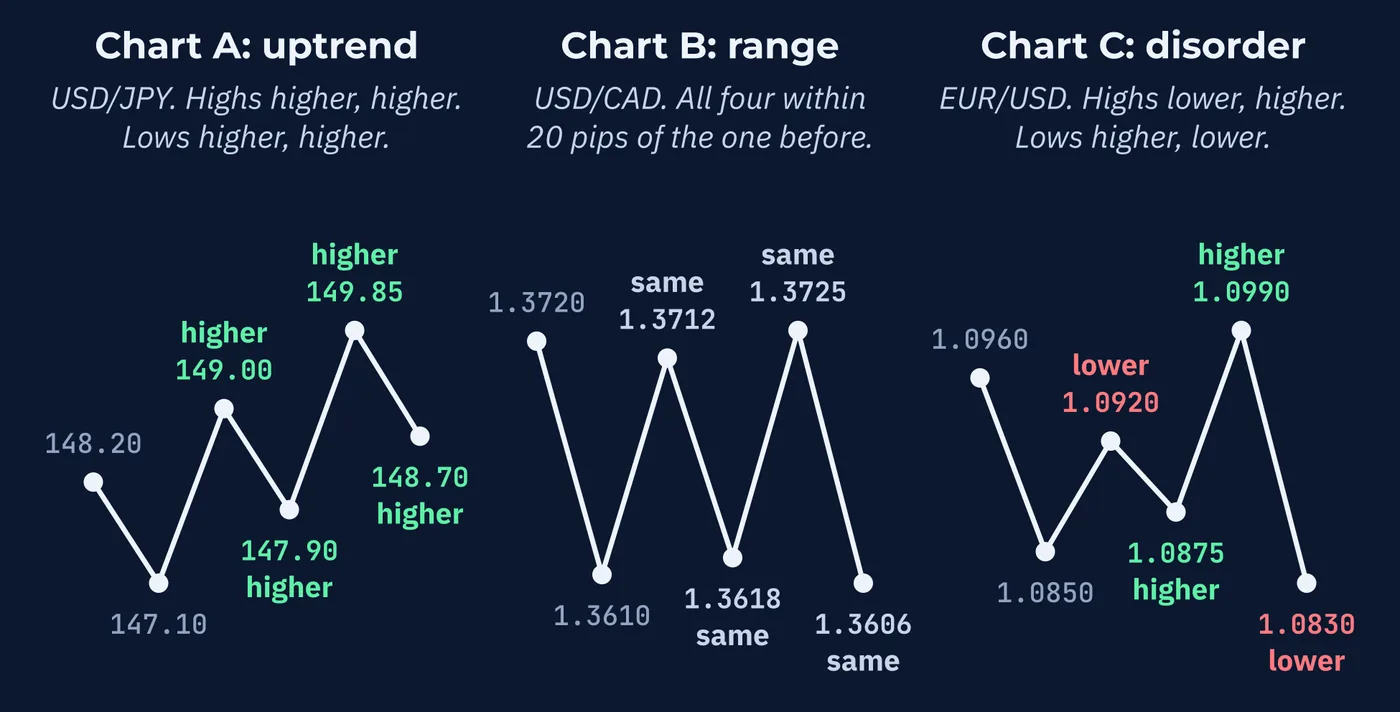
Chart D is the instructive one. The second high is 25 pips above the first, which counts as higher. The third is 15 pips above the second, which is inside the tolerance, so it counts as about the same. The lows go the other way round, 12 pips and then 22. The labels do not agree, so the routine says disorder. That is a fair description of a chart that is leaning upward without having committed.
Now change the tolerance to 10 pips. Every one of those four gaps is larger than 10, so every label reads higher, and the same chart is an uptrend.
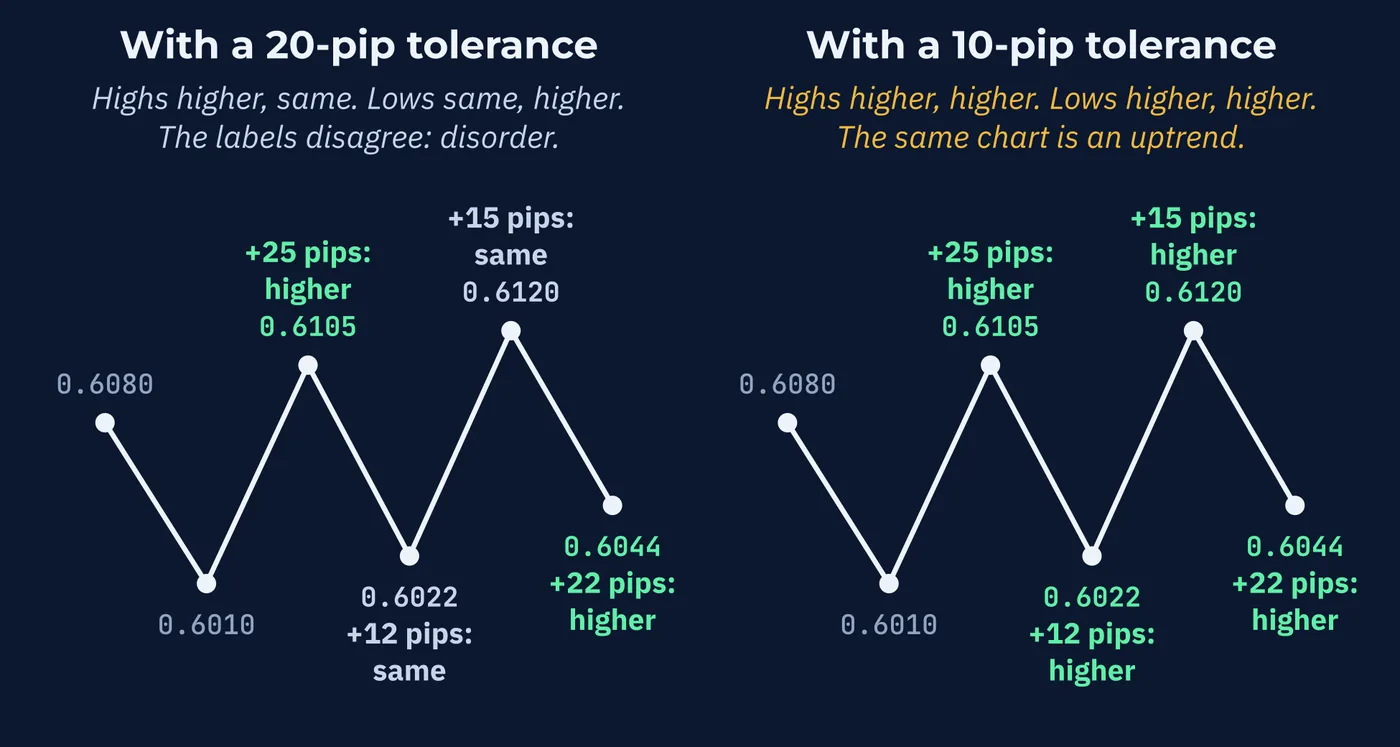
Neither answer is wrong. They answer different questions, the same way small swings and large swings did in Lesson 56. What would be wrong is choosing the tolerance after seeing which answer you prefer. Fix it first and use it on every chart, and your readings will mean the same thing from one week to the next.
6How One State Becomes Another
Markets do not stay in one state. They move between them, and some paths are common.
| From | To | What It Looks Like |
|---|---|---|
| Trend | Range | The trend stops making new highs or lows and price settles between two edges |
| Range | Trend | Price breaks out of one edge and starts making new swings in that direction |
| Trend | Disorder | The swings stop lining up, often with wide moves both ways |
| Disorder | Range or trend | The swings gradually settle into one shape or the other |
None of these paths is guaranteed. A trend can go straight into a reversal with almost no pause, and a range can break, fail, and settle back into a range.
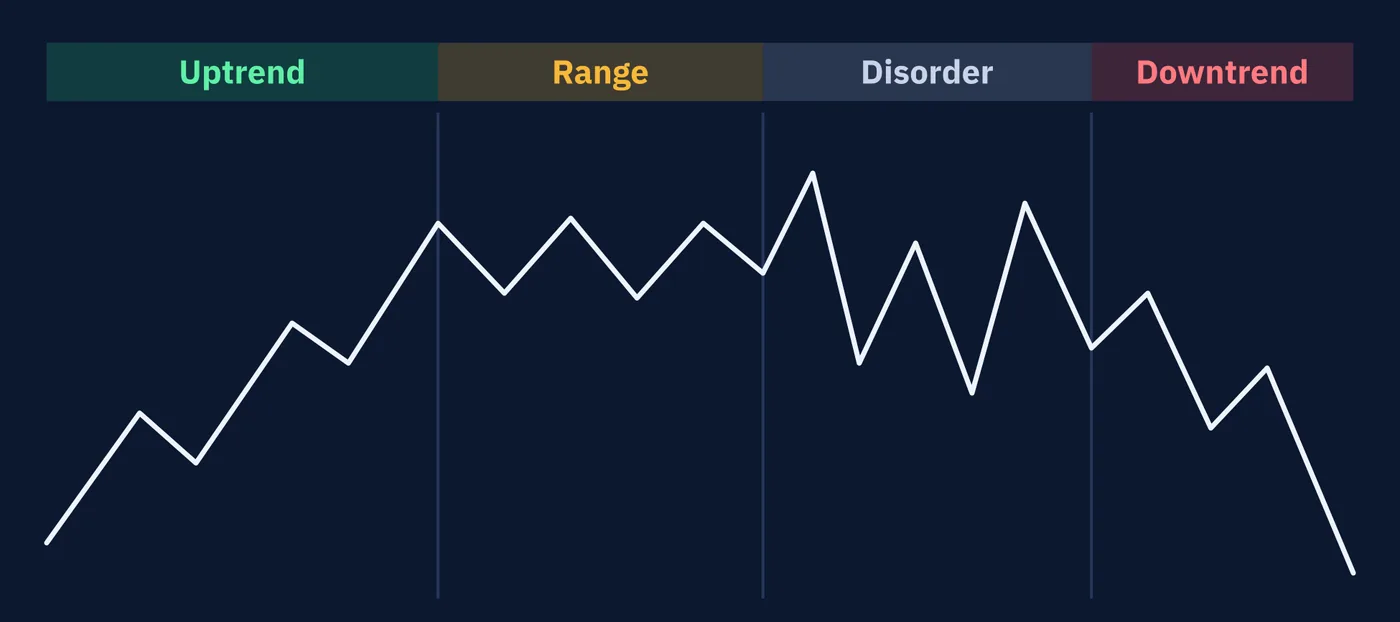
The routine from Section 4 shows a change one swing at a time. Take Chart B, the range. Suppose its next high comes in at 1.3790 and its next low at 1.3680. Drop the oldest high and the oldest low, and run the routine again.
The highs now read about the same, then higher. The lows read about the same, then higher. The labels disagree, so the range has become disorder. One more higher high and one more higher low, and the same chart would read as an uptrend. That is a range turning into a trend, and the routine passes through disorder on the way.
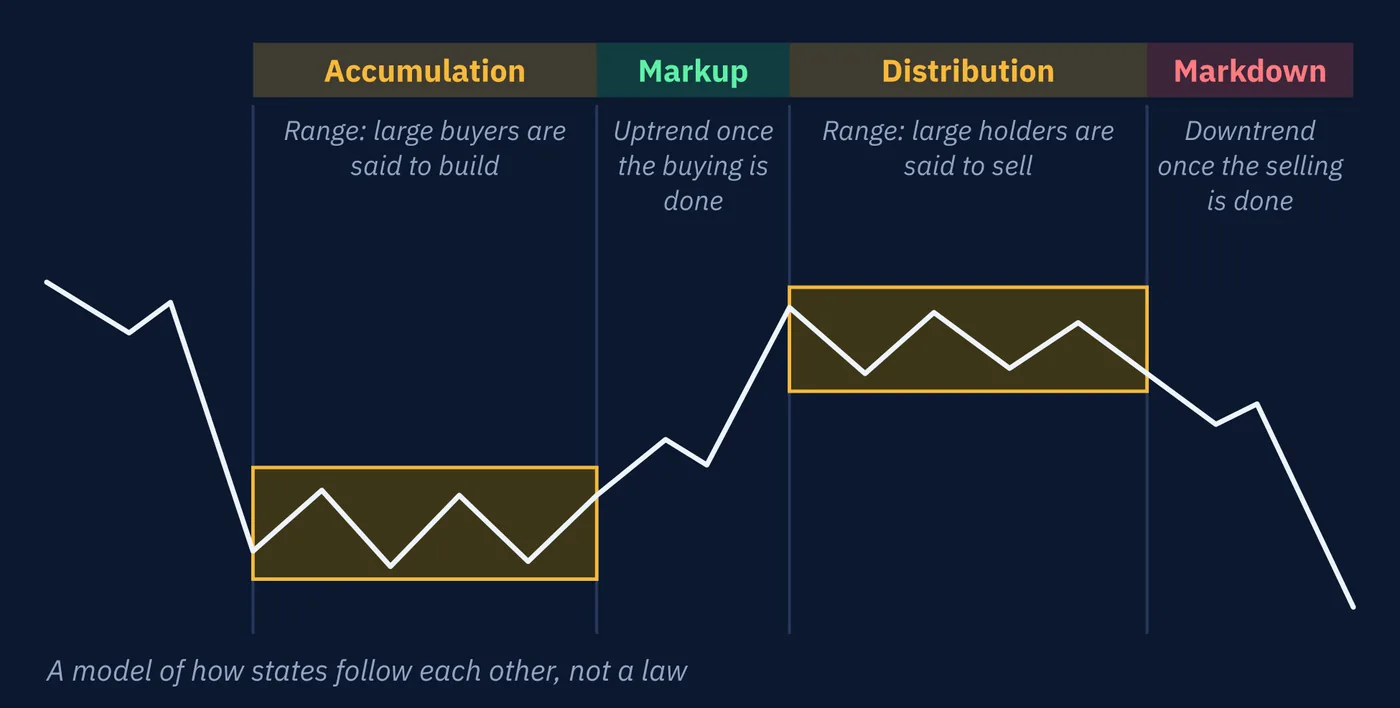
One popular map of how states follow each other comes from Richard Wyckoff, who wrote about the stock market in the early 1900s. It describes a cycle of four phases.
| Phase | State | The Story the Model Tells |
|---|---|---|
| Accumulation | Range | Large buyers quietly build positions after a fall |
| Markup | Uptrend | Price rises once the buying is done |
| Distribution | Range | Large holders quietly sell into the rise |
| Markdown | Downtrend | Price falls once the selling is done |
It is a useful map, and many later methods borrow from it, including the ones in Lesson 79. But it is a model, not a law. The same range could be accumulation or distribution, and Lesson 57 showed that nothing inside a range tells you which way it will break. The labels tend to become clear only afterward.
7Only Clear Once Under Way
Every state is identified from swings that have already happened, so every reading lags.
A trend needs at least two higher highs and two higher lows before the definition recognizes it, and by then the move is well under way. A range needs price to have turned at both edges, more than once, before anyone can see the edges. Disorder is usually recognized only after a run of swings has refused to fit anything else.
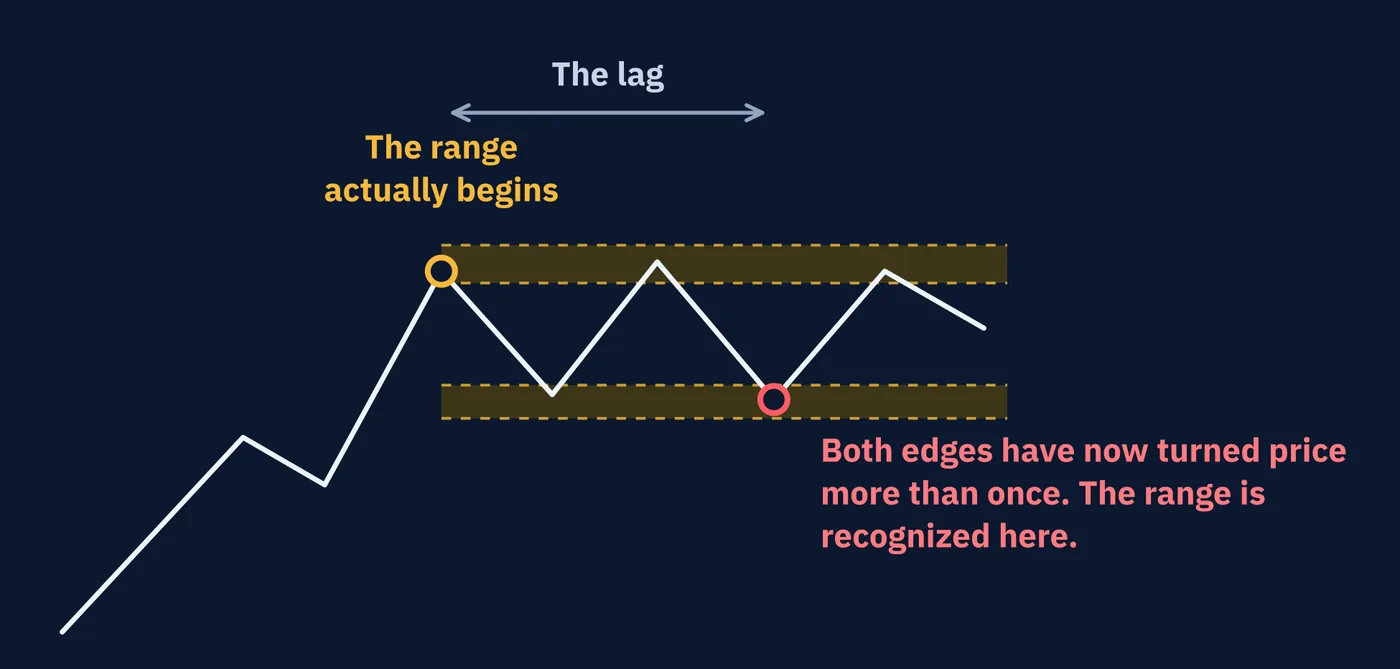
Chart A in Section 5 shows the cost in numbers. Its rise began at 147.10. The routine could not call it an uptrend until the third low had formed at 148.70. By then 160 pips of the move were already behind it.
So at any moment, the honest description of the current state is really a description of the recent past. The state may already have changed, and the swings that would show it have not formed yet. This is the same trade-off Lesson 56 described for the end of a trend, applied to every state at once.
8Why the State Matters
The state of a market matters because methods are built with a state in mind.
A method that assumes price will keep moving in one direction depends on trends. In a range it tends to buy near the top and sell near the bottom, just as price turns. A method that assumes edges will hold depends on ranges. When a range breaks into a trend, that method keeps betting on an edge that has stopped working. Disorder is difficult for both, because neither assumption is holding.
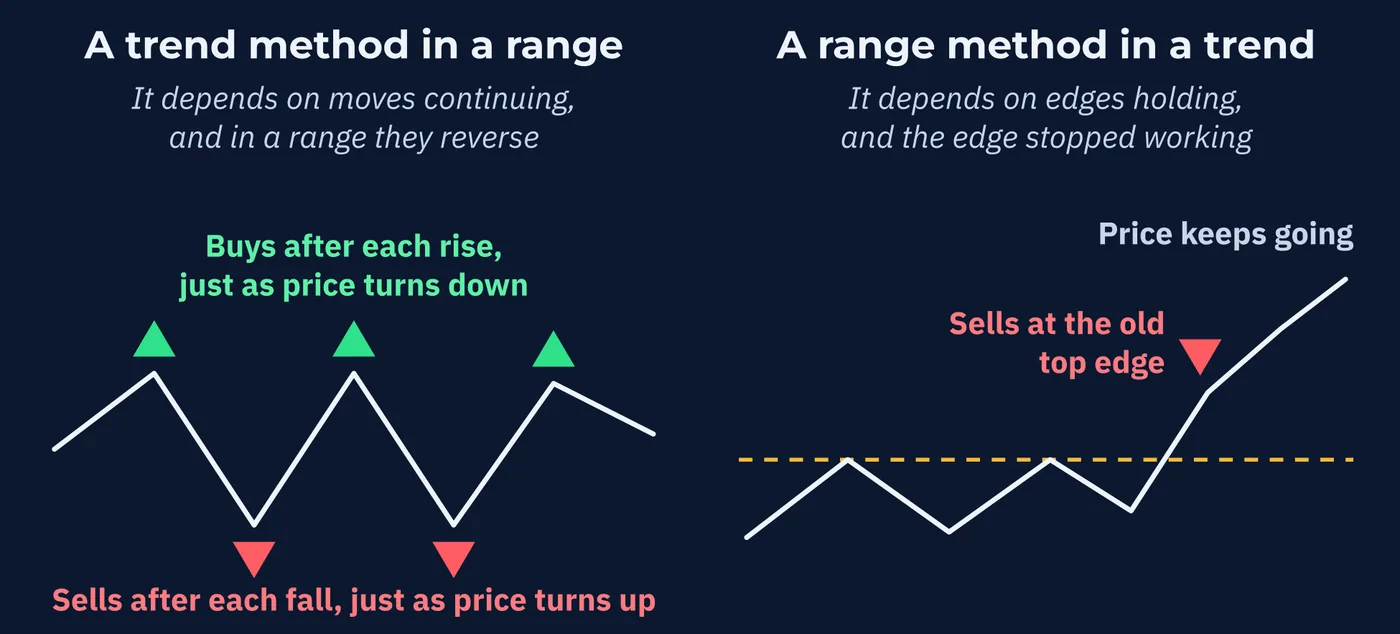
The charts from Section 5 put numbers on it. Suppose a method buys whenever price makes a new high, expecting the move to continue. On Chart B the third high, 1.3725, was a new high by 5 pips. Price then fell to 1.3606, which is 119 pips lower. The method did what it was built to do. The market was in the wrong state for it.
Now suppose a method treats the last high as an edge and sells when price returns to it. On Chart A that means selling near 148.20. Price went on to 149.00 and then to 149.85, which is 165 pips higher.
This course's later series are organized around exactly that split. Series N covers strategies that assume continuation, and Series O covers strategies that assume boundaries hold. Each one will be judged partly by how it behaves when the market is in a state it was not built for.
9A Second Dial: Quiet or Busy
The three states describe shape. There is a second, separate thing to notice, which is how much price is moving.
A trend can be a slow, steady climb or a violent run. A range can be 40 pips wide or 400. Disorder is often busy, but it can be quiet too. Shape and activity are different dials, and a chart can sit at any combination of them.
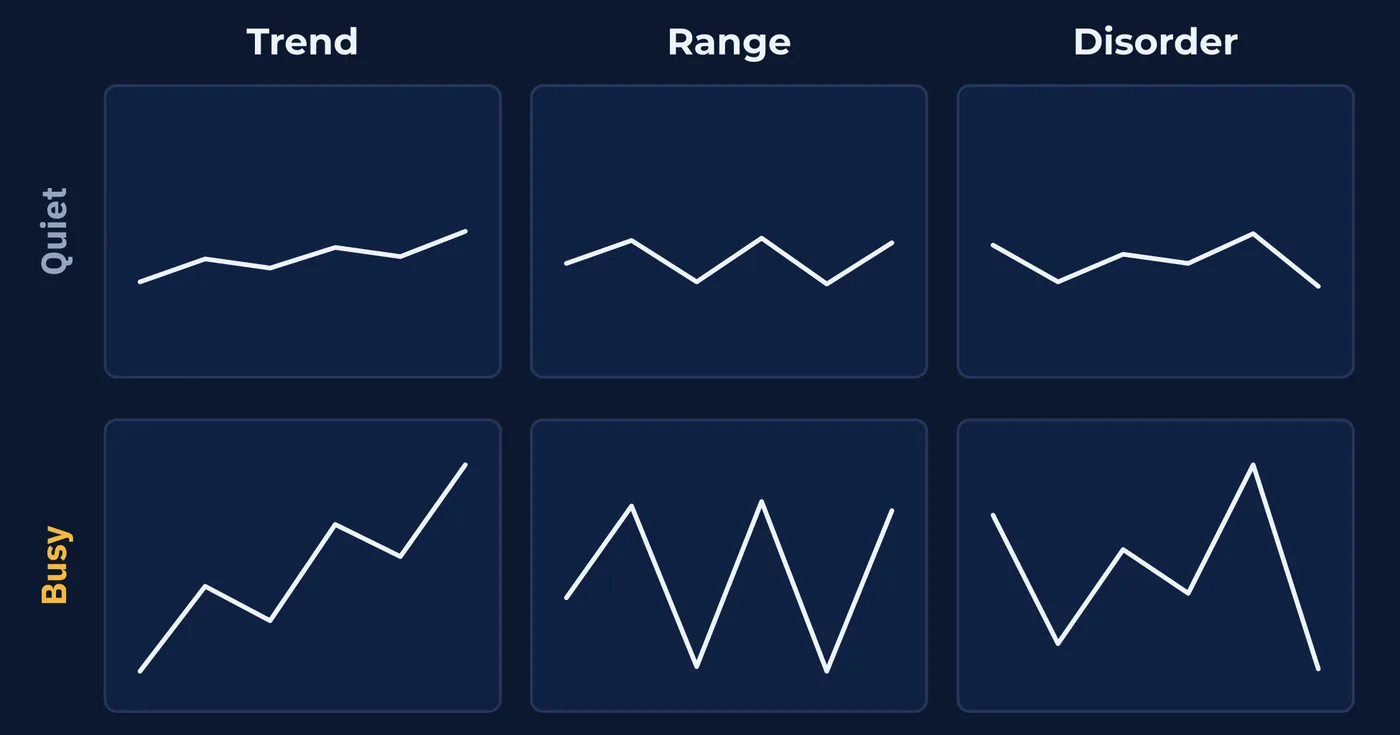
Lesson 57 described volatility clustering, the tendency for busy periods to follow busy ones and quiet periods to follow quiet ones. That applies to this second dial, and it can change independently of the first. Lesson 65 covers how activity is measured.
10What the Research Says
Economists have studied whether currencies really move between states, or whether that is just the eye finding patterns.
In a 1990 study, Charles Engel and James Hamilton looked at the dollar against the German mark, the French franc, and the British pound from 1973 to 1988. They found the dollar's movement was better described as switching between two states, a rising one and a falling one, than as a series of random steps. Each state tended to last a few years. A 2005 study by Franc Klaassen used a more careful test and reached the same conclusion.
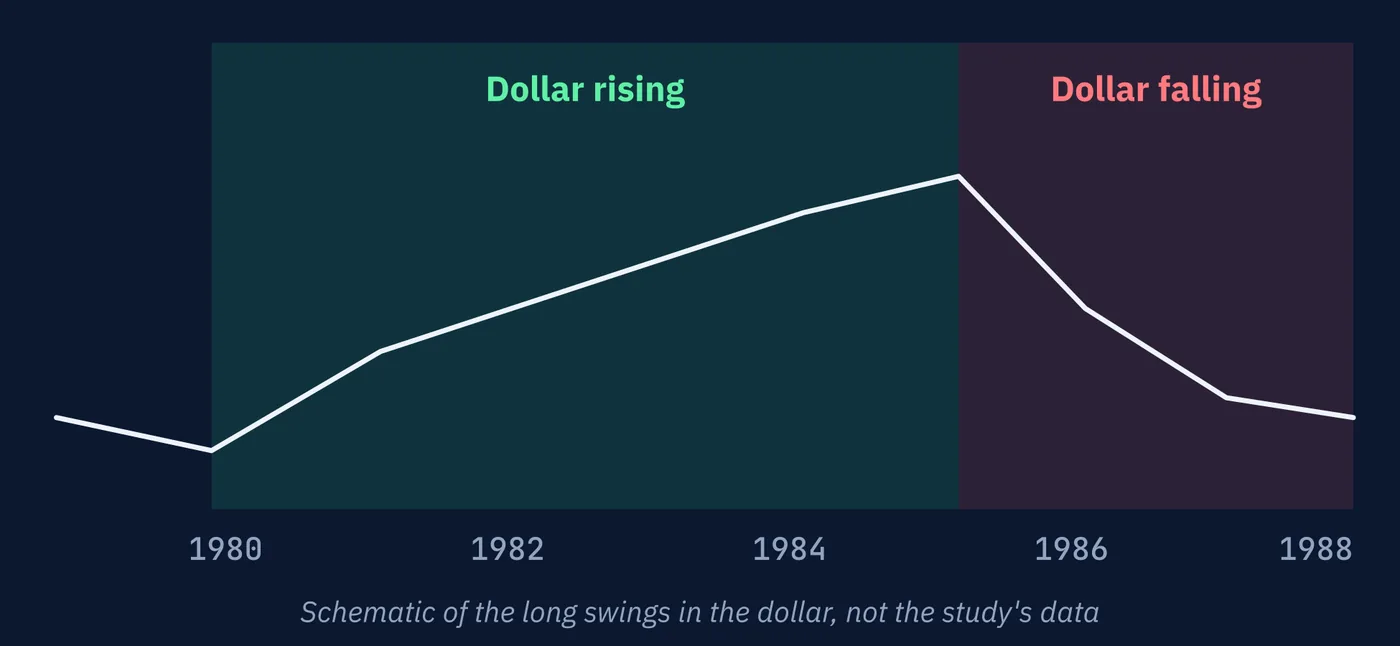
Three details keep this in proportion. The studies used data measured once every three months, so the swings were years long, not hours. The models chose how many states to allow, typically two, which is a modeling choice rather than a discovery. And even the models only estimate the probability of being in a state at any given time. They do not see the change as it happens either.
So the research supports the idea that currencies move in states. The number three is this course's teaching choice. And no one, including the economists, can name the current state with certainty.
States are made of swings, and swings are made of candles. The next lesson looks at what a single candle can tell you, and what it cannot.
Three Things to Remember
Try This
Thirty minutes with one chart and a calendar.
Words From This Lesson
| Term | What It Means |
|---|---|
| Market state | The overall shape of price over a stretch of time: trend, range, or disorder. |
| Disorder | This course's name for a state in which the swings contradict each other and fit neither a trend nor a range. |
| Choppy | A common trading term that sometimes means disorder and sometimes means any sideways market. |
| Wyckoff cycle | A model of four phases, accumulation, markup, distribution, and markdown, describing how states follow each other. |
| Accumulation | In the Wyckoff model, a range in which large buyers are said to build positions. |
| Distribution | In the Wyckoff model, a range in which large holders are said to sell. |
| Markup and markdown | In the Wyckoff model, the uptrend that follows accumulation and the downtrend that follows distribution. |
| Regime | The term economists use for a market state when they model switching between states. |
| Tolerance | How close two prices must be to count as about the same, chosen before the chart is read. |
| Broadening pattern | Swings that spread apart, with higher highs and lower lows. A form of disorder. |
Test Your Knowledge
Ten questions. Answer them all before checking the key on the following pages. If a question gives you trouble, the answer key tells you which section to revisit.
- A. A downtrend
- B. A market that is closed for the weekend
- C. A market whose swings contradict each other and fit neither a trend nor a range
- D. A very narrow range
- A. Uptrend
- B. Downtrend
- C. Disorder
- D. Range
- A. Volatile describes how much price is moving, while disorder describes the shape of the swings
- B. Volatile is a newer word
- C. Disorder is the official industry term
- D. Disordered markets are always quiet
- A. Uptrend
- B. Downtrend
- C. Disorder
- D. Range
- A. Choose the tolerance before reading the chart, and use the same one every time
- B. Use whichever tolerance gives a trend
- C. Average the two answers
- D. Move to a different pair
- A. A proven law that every market follows
- B. A popular model of four phases describing how states follow each other
- C. A type of moving average
- D. A central bank policy cycle
- A. Charts are updated slowly
- B. States change only on Mondays
- C. Brokers hide the current state
- D. States are identified from swings that have already formed
- A. It performs best in this condition
- B. It keeps betting on an edge that has stopped working
- C. It automatically switches to following the trend
- D. Nothing, because state does not affect methods
- A. A trend is always busy and a range is always quiet
- B. Shape and activity are the same thing
- C. Activity determines the state
- D. They are separate dials, and a chart can be at any combination of them
- A. Its movement was purely random
- B. It moved in three states that changed every few hours
- C. It was better described as switching between a rising and a falling state, each tending to last a few years
- D. It never moved in long swings
Answer Key
Each answer explains why the correct choice is correct, why the others are not, and where to reread.
Question 1 · correct answer C
Disorder is the state in which swings contradict each other. Traders often call it choppy, though that word is also used for any sideways market.
A is part of the trend state. B has nothing to do with chart structure. D is still a range, however narrow.
Review: Section 1, Three Readings
Question 2 · correct answer C
Each swing contradicts the one before it. The highs and lows fit neither a trend nor a range, which is the signature of disorder.
A ignores the lower low. B ignores the higher high. D ignores how far apart the highs and lows are.
Review: Section 2, The Unclear Middle
Question 3 · correct answer A
Volatile describes activity, which is a separate dial from shape. A disordered market can be busy or quiet, so a name about speed would describe the wrong thing.
B is not the reason. C is wrong because there is no standard name for this state. D contradicts the lesson, which says disorder can be busy or quiet.
Review: Section 3, Why It Needs a Name, and Why This One
Question 4 · correct answer D
The highs differ by 12 and 17 pips, and the lows by 9 and 17. All four gaps are inside the 20-pip tolerance, so all four labels read about the same. That is a range.
A and B would need both highs and both lows to move the same way by more than the tolerance. C would need the labels to disagree, and here all four agree.
Review: Section 4, How to Classify a Chart
Question 5 · correct answer A
Both readings are honest answers to different questions. What makes a reading useful is that the tolerance was fixed first and is the same on every chart.
B picks the tolerance after seeing the result, which is the one thing the lesson warns against. C has no meaning, since a reading is a label and not a number. D avoids the question.
Review: Section 5, Four Charts, Classified
Question 6 · correct answer B
The Wyckoff cycle describes accumulation, markup, distribution, and markdown. It is a useful map, but a model rather than a law.
A overstates it, since the same range could be accumulation or distribution. C and D are unrelated.
Review: Section 6, How One State Becomes Another
Question 7 · correct answer D
A trend needs several swings before it is recognized, and a range needs turns at both edges. By the time the swings exist, the state is already under way.
A and C describe technical problems that are not the cause. B is invented.
Review: Section 7, Only Clear Once Under Way
Question 8 · correct answer B
A method built on edges holding depends on a range. When the range breaks into a trend, it keeps acting on an edge that no longer works.
A reverses it. C describes something a fixed method does not do. D contradicts the main point of Section 8.
Review: Section 8, Why the State Matters
Question 9 · correct answer D
Shape tells you trend, range, or disorder. Activity tells you how much price is moving. A trend can be quiet or violent, and a range can be narrow or wide.
A pairs each state with one level of activity, which the lesson rejects. C and B merge two separate things.
Review: Section 9, A Second Dial: Quiet or Busy
Question 10 · correct answer C
The study found the dollar was better described as switching between a rising state and a falling state than as random steps, with each state tending to last a few years.
A is the idea the study rejected. B mixes up the course's three states with the study's two and invents the timescale. D contradicts the finding.
Review: Section 10, What the Research Says
Keep going
Reading Price Structure is written by Kanin D. Alldredge for The Currency Classroom, and it is free to read. There is more free from CNS: start here.
Start free with CNS →