Ranges

1Neither Up Nor Down
Lesson 56 gave three possible readings of a chart. Higher highs and higher lows make an uptrend. Lower highs and lower lows make a downtrend. Anything else is neither.
The most common form of neither is a range. The highs stop at roughly the same price each time, the lows stop at roughly the same price each time, and price moves back and forth between them.
Here is an illustrative GBP/USD chart over several weeks.
| Turning Point | Price | Compared With the Last One |
|---|---|---|
| High | 1.2795 | Starting point |
| Low | 1.2655 | Starting point |
| High | 1.2806 | About the same |
| Low | 1.2643 | About the same |
| High | 1.2801 | About the same |
| Low | 1.2652 | About the same |
No higher highs, no lower lows. Price is going somewhere every day and nowhere over the month.
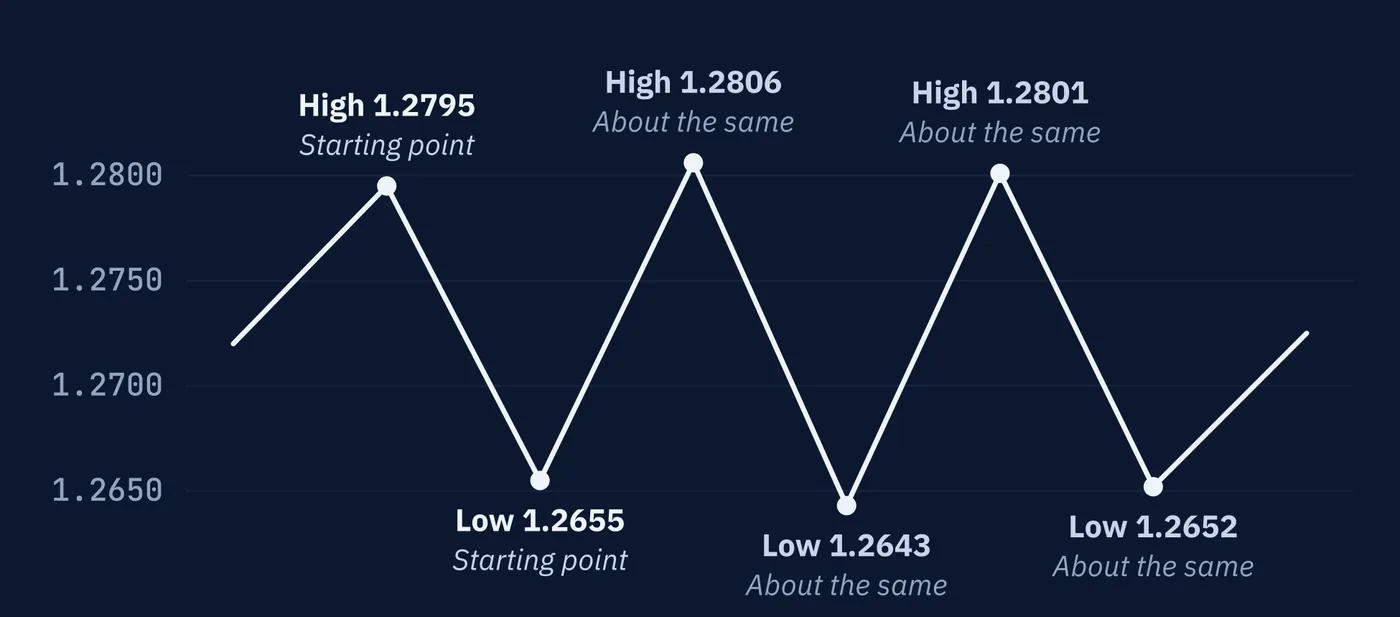
You will also hear this called a sideways market, and a pair inside a range called range-bound.
2The Edges Are Levels
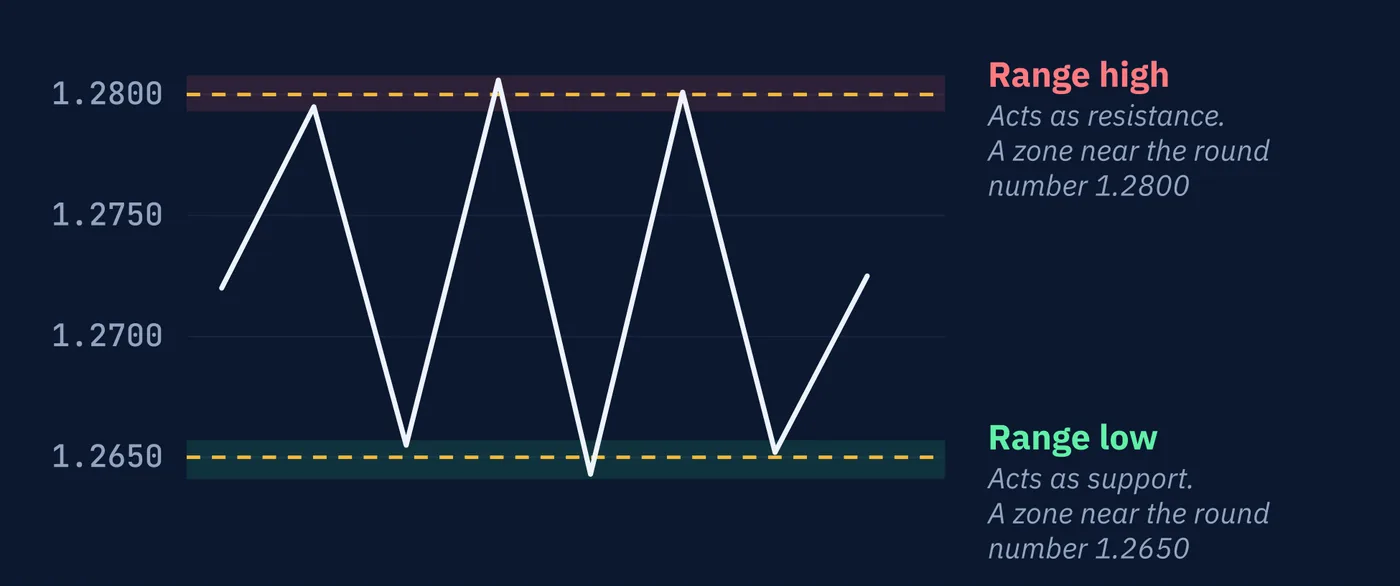
A range is two levels from Lesson 55 working at the same time. The top edge, here near 1.2800, is resistance. The bottom edge, near 1.2650, is support. Traders often call the edges the range high and range low, or simply the boundaries.
Everything Lesson 55 said about levels applies to both edges. They are zones rather than lines. Notice that the highs in the table landed at 1.2795, 1.2806, and 1.2801, not at one exact price. They are held by orders and by people's memory of where price turned. And they describe what has happened, not what will.
It is no accident that both edges here sit near round numbers. Lesson 55 explained why waiting orders gather at prices like these.
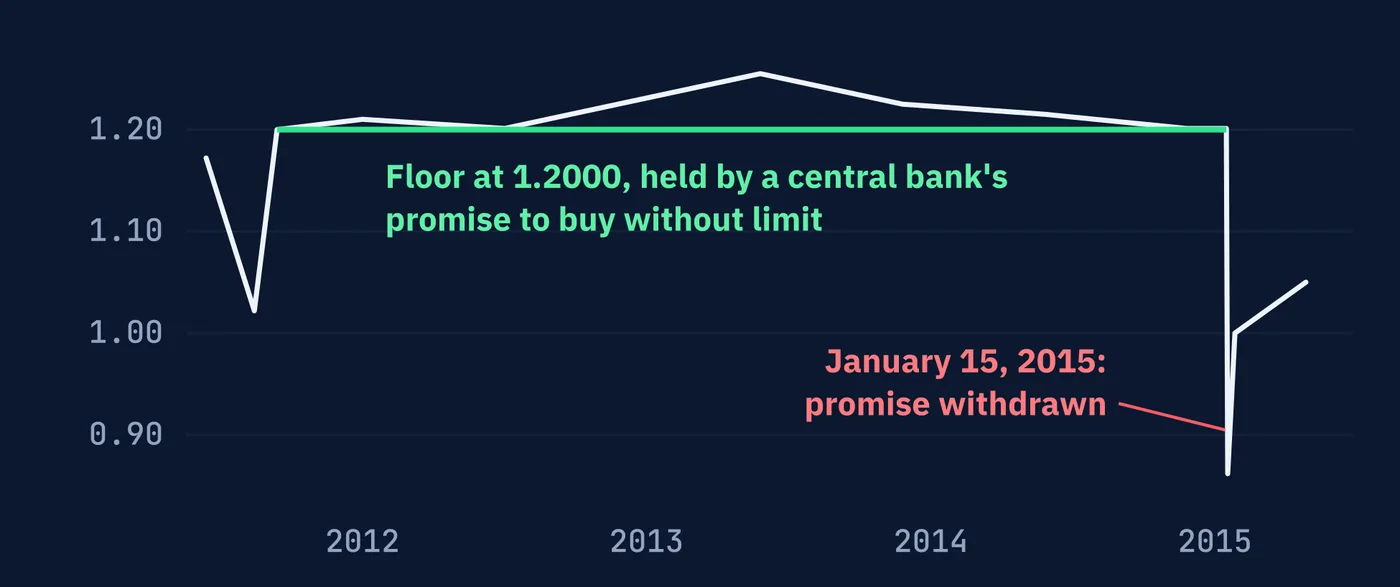
promise was withdrawn.
3Describing a Range in Numbers
Saying a pair is ranging tells someone very little. Three numbers tell them most of what matters.
| Measure | In the Example | What It Tells You |
|---|---|---|
| Width | About 150 pips, from 1.2650 to 1.2800 | How much room price has inside the range |
| Duration | Several weeks | How long the market has been in balance |
| Touches | Three at each edge | How many times each edge has turned price |
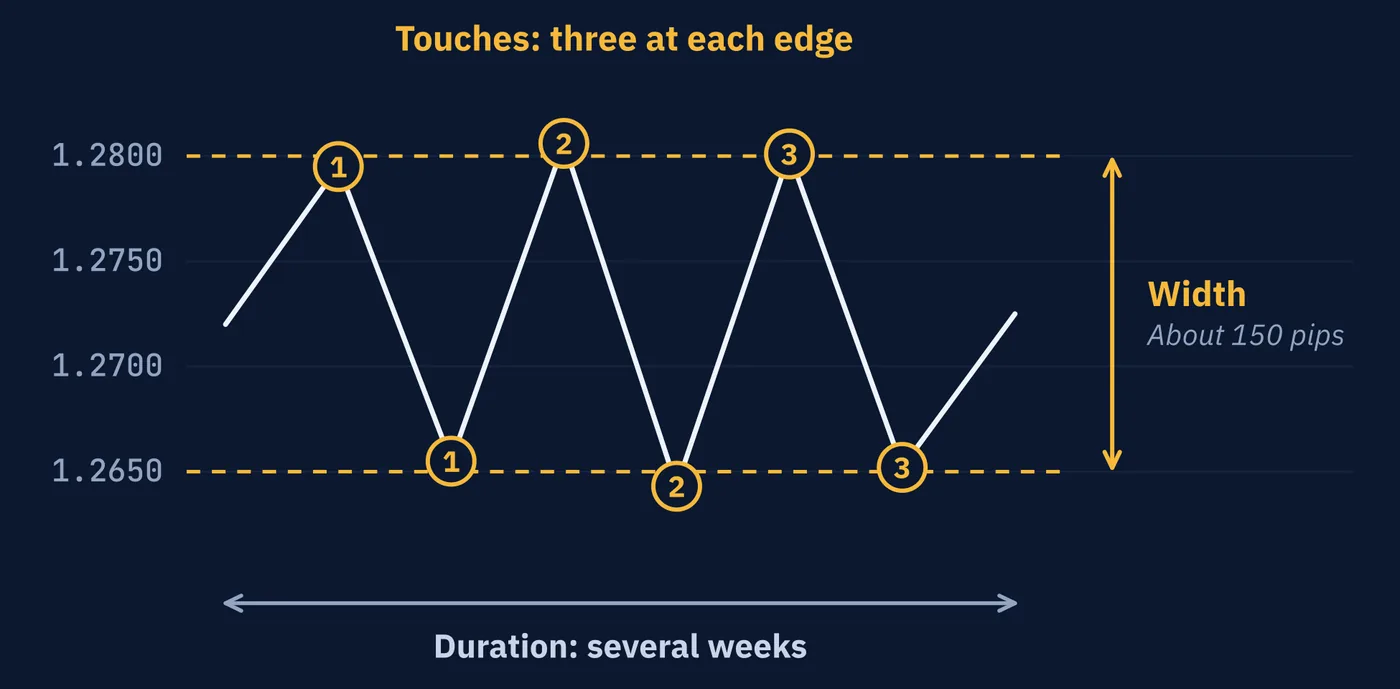
Width means most when you compare it with how far the pair usually moves. A 150-pip range is wide for a pair that typically moves 50 pips a day, because it takes several days to cross. It is narrow for a pair that typically moves 150 pips a day, because a single day can cover all of it. Lesson 65 covers how that typical movement is measured.
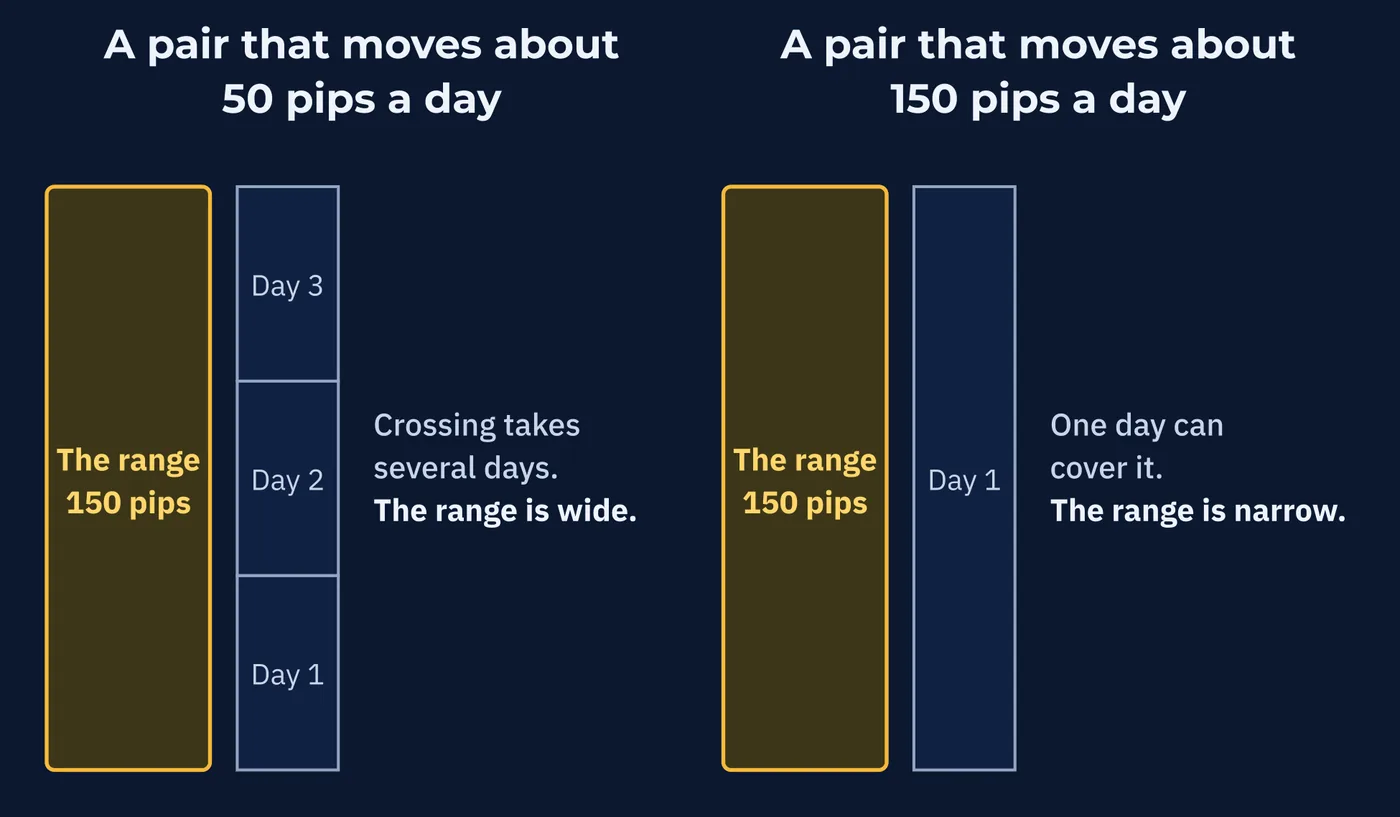
Touches need the same caution Lesson 55 gave. More touches can mean more attention, or it can mean the orders at the edge are being used up.
How many touches make a range? There is no official count, but most traders want at least two turns at each edge before they use the word. One high and one low are only a swing.
4The Midpoint
A fourth number is worth adding, the midpoint. It is the price halfway between the edges.
In the GBP/USD example the edges are 1.2650 and 1.2800. Add them together, divide by two, and the midpoint is 1.2725. Everything above it is the upper half of the range. Everything below it is the lower half.
The midpoint answers a practical question: where is price inside the range right now? Say GBP/USD is at 1.2770. It is 30 pips from the top edge and 120 pips from the bottom. That puts it in the upper half, four-fifths of the way up.
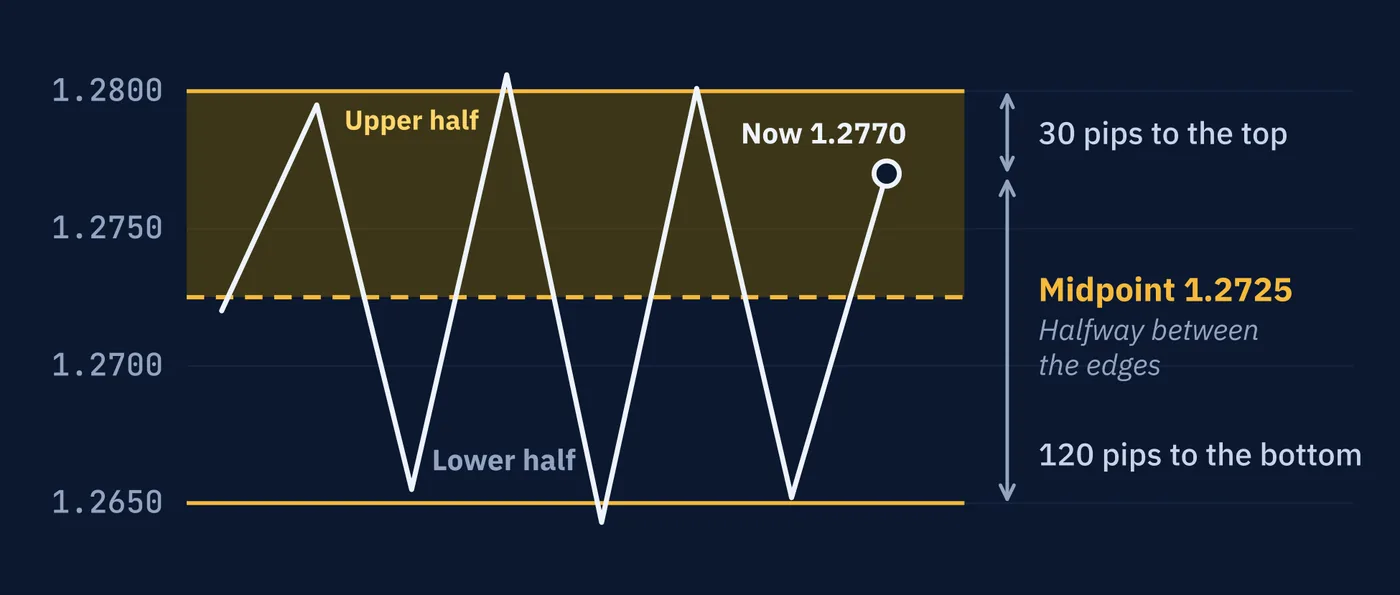
At the midpoint a range tells you least. Both edges are 75 pips away, and neither is close enough to matter yet. Near an edge it tells you most, because that is where Lesson 55 said the decision happens.
Some traders treat the midpoint as a level in its own right and call it the mid-range or the equilibrium. Treat that with care. An edge has turned price before, which is what makes it a level. A midpoint is arithmetic. It becomes a level only if price starts turning there.
Here is a second range, measured from start to finish. Over five weeks an illustrative AUD/USD chart turns down at 0.6642, 0.6650 and 0.6645, and turns up at 0.6561, 0.6552 and 0.6558.
| Measure | Working | Result |
|---|---|---|
| Edges | Highs near 0.6645, lows near 0.6555 | Two zones |
| Width | 0.6645 minus 0.6555 | 90 pips |
| Duration | First turn to last | Five weeks |
| Touches | Count the turns at each edge | Three and three |
| Midpoint | 0.6645 plus 0.6555, divided by two | 0.6600 |
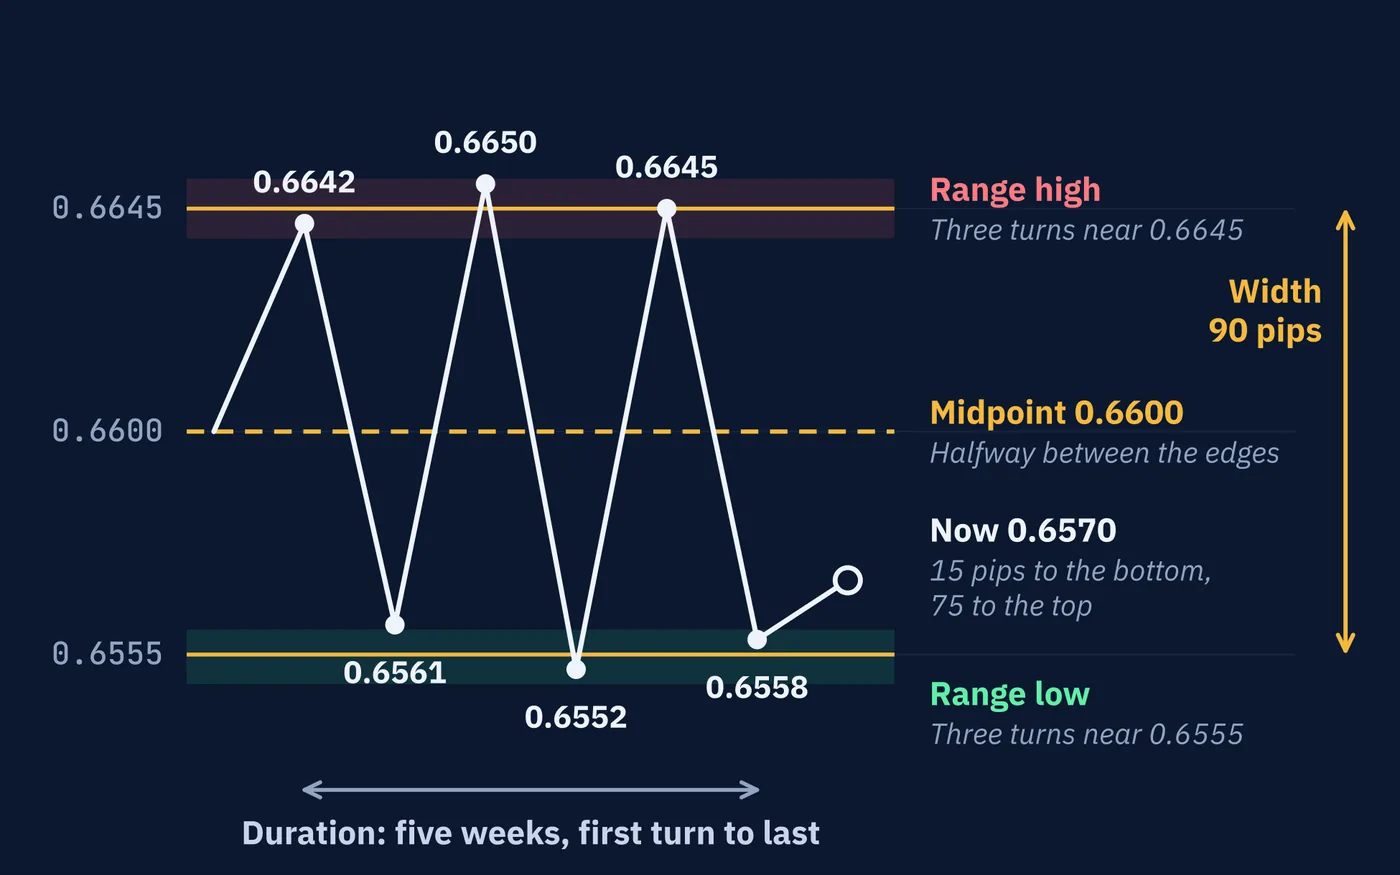
marked.
The midpoint lands on a round number, 0.6600, which gives traders a second reason to watch it. If the pair usually moves about 60 pips a day, the range is a day and a half wide, which is narrow. And with price at 0.6570, the bottom edge is 15 pips away and the top edge is 75.
5What Builds Up Outside a Range
While price moves sideways, something is quietly accumulating just beyond both edges.
Think about the traders acting inside the range. Some sell near the top, expecting the edge to hold. Many of them protect themselves with a stop-loss order just above the top. Others buy near the bottom and place their stops just below the bottom.
The edges themselves collect orders too. A trader who bought near 1.2650 may leave a take-profit order near 1.2800, and one who sold near the top may aim to take profit near the bottom. That is part of why the edges keep holding while the range lasts.
Every week the range lasts, more of these orders can pile up. Above the top edge sit stop orders that will buy. Below the bottom edge sit stop orders that will sell.
Lesson 55 described what stops just past a level do when price reaches them. They push the move further in the direction it is already going. A range collects them on both sides at once.
A range does not only hold price in. It stores orders on both sides of it.
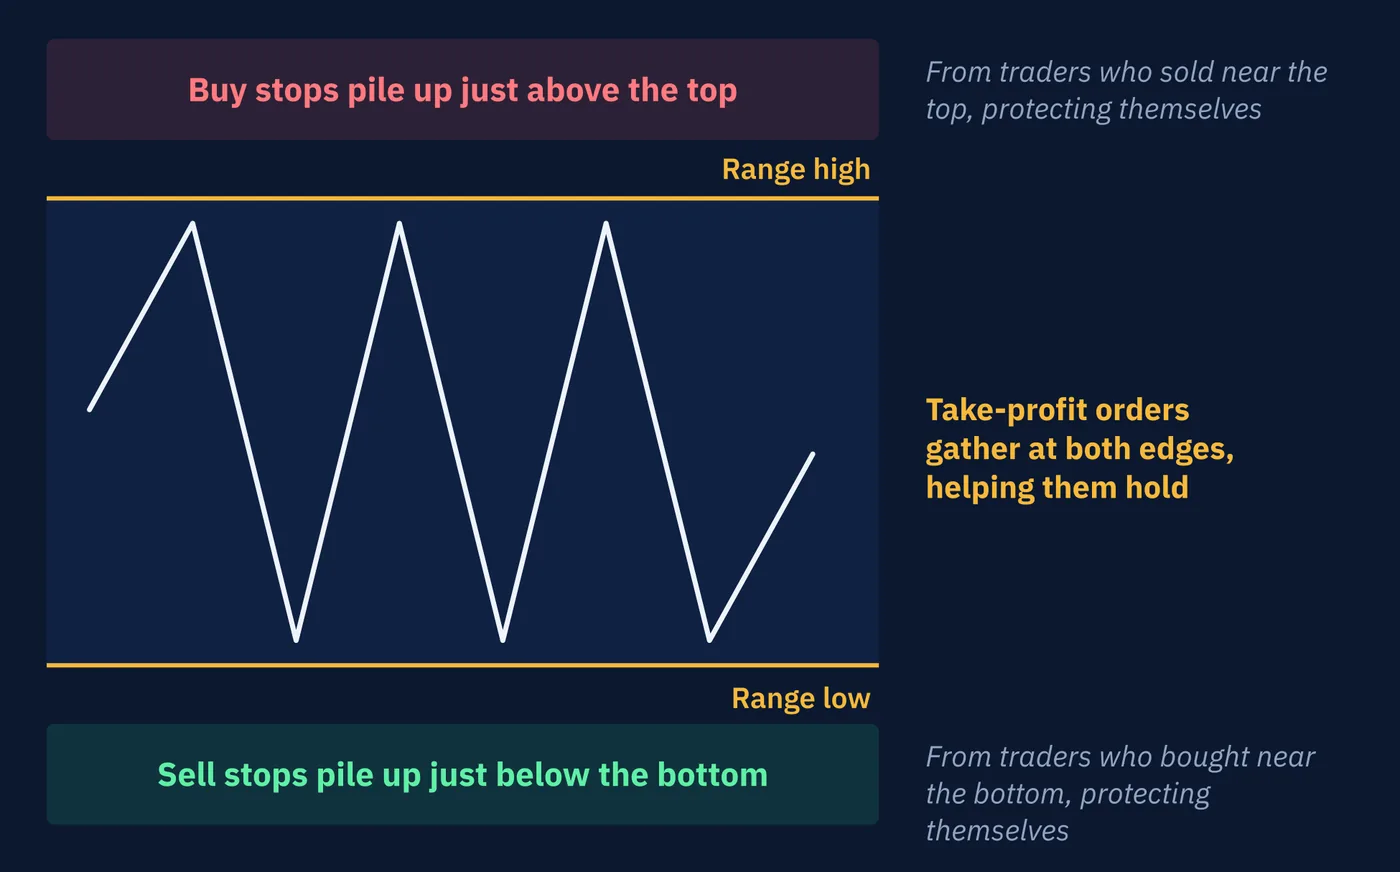
This is reasoning from the order study in Lesson 55, not a measurement. Nobody outside a dealing desk can see how many stops sit beyond a particular range. But it fits a pattern traders see often: price breaking out of a long, quiet range and moving fast.
6Quiet Tends to Stay Quiet
You will often hear a tight range described as a coiled spring, as if a long quiet stretch means a big move must be coming soon. The research on how markets move points the other way, at least on average.
In 1963 the mathematician Benoit Mandelbrot observed that in price data, large changes tend to be followed by large changes, of either direction, and small changes by small changes. Economists call this volatility clustering. Robert Engle shared the 2003 Nobel Prize in economics for methods that model it, and it has been found across stocks, bonds, and currencies.
The practical meaning is simple. Calm periods tend to be followed by more calm, and busy periods by more activity. A quiet range is, on average, more likely to stay quiet tomorrow than to explode.
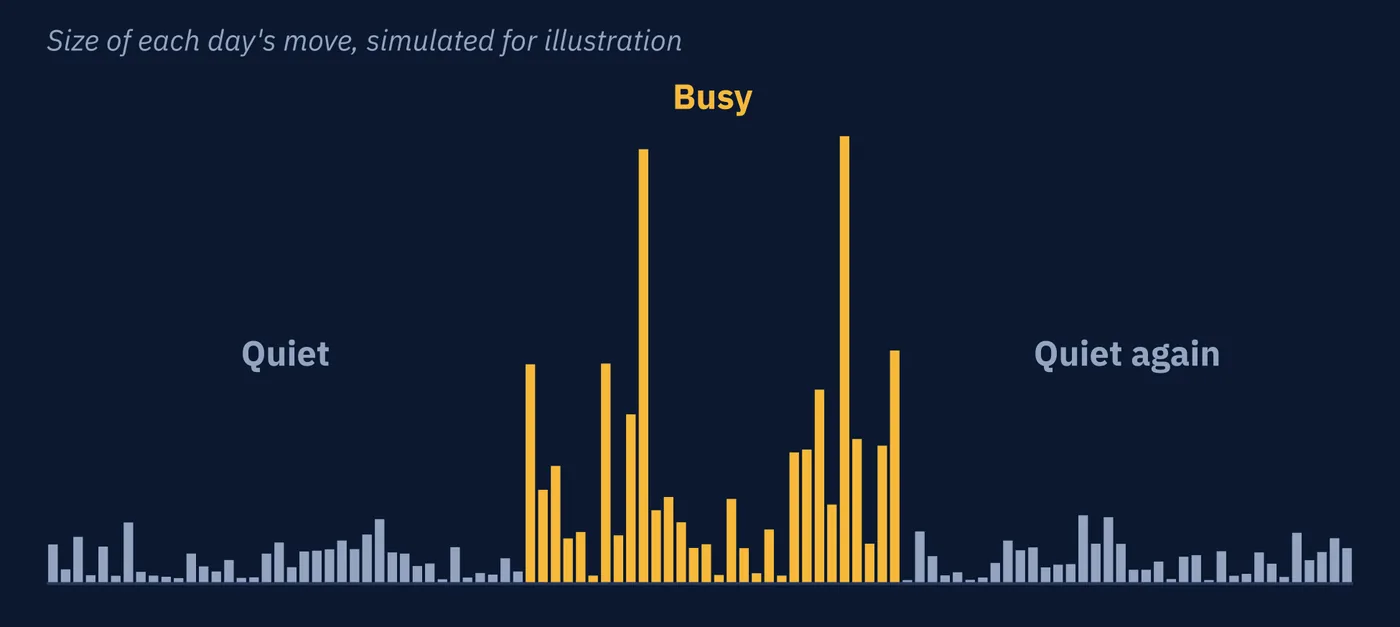
tend to stay busy.
So which is it, a spring or a calm that persists? Both describe something real. Quiet tends to last. And when a quiet range does end, the orders it stored can make the break fast. What neither idea gives you is a schedule. Nothing about a range tells you when it will end.
7How a Range Ends
Every range ends, and it ends one of two ways. Price breaks out above the top edge or below the bottom edge.
Nothing in the range itself tells you which side it will be. The range is the market in balance, and a balance does not announce which way it will tip.
Breaks are also messy. Price often pushes through an edge, triggers some of the stored stops, and then falls straight back inside. Lesson 43 explained why these false breaks form. Sometimes price breaks one side, fails, and then breaks the other.
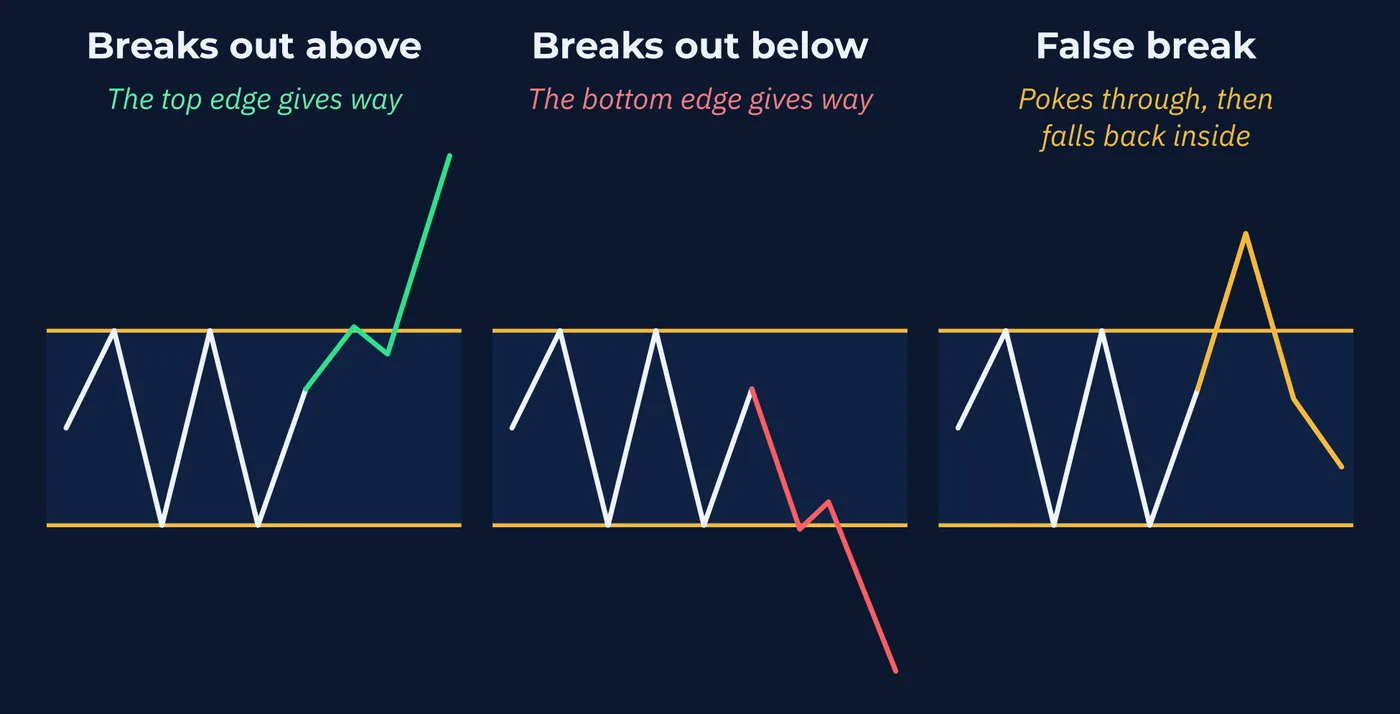
When a break does hold, the old edge can switch roles, as Lesson 55 described. The top of the old range can become support on a retest. Lesson 71 looks at breakouts in full.
8False Breaks and Their Names
A break out of a range is called a breakout, and a break below the bottom edge is sometimes called a breakdown. Section 7 said many of them fail. The failures have names of their own, and the name depends on which edge was broken. Buyers are called bulls and sellers are called bears, which is where two of the names come from.
| Name | What Happens | Who Is Caught |
|---|---|---|
| False break | Price breaks an edge and comes back inside. Also called a fakeout | Anyone who acted on the break |
| Bull trap | A false break above the top edge | Traders who bought the break |
| Bear trap | A false break below the bottom edge | Traders who sold the break |
Take the GBP/USD range from 1.2650 to 1.2800. On Wednesday price trades up to 1.2832 and closes the day at 1.2788. On Thursday it falls to 1.2740.
Lesson 55 gave two ways to count a break. By the first, any trade beyond the edge, the range broke on Wednesday and the break had failed by Thursday. That is a bull trap. A trader who bought at 1.2820 expecting a breakout is 80 pips down at Thursday's low.
By the second, a close beyond the edge, the range never broke at all. Wednesday closed back inside at 1.2788.
The bottom edge gives the mirror image. Price trades down to 1.2618, closes the day at 1.2662, and is at 1.2712 a day later. That is a bear trap, and the traders caught are the ones who sold the break.
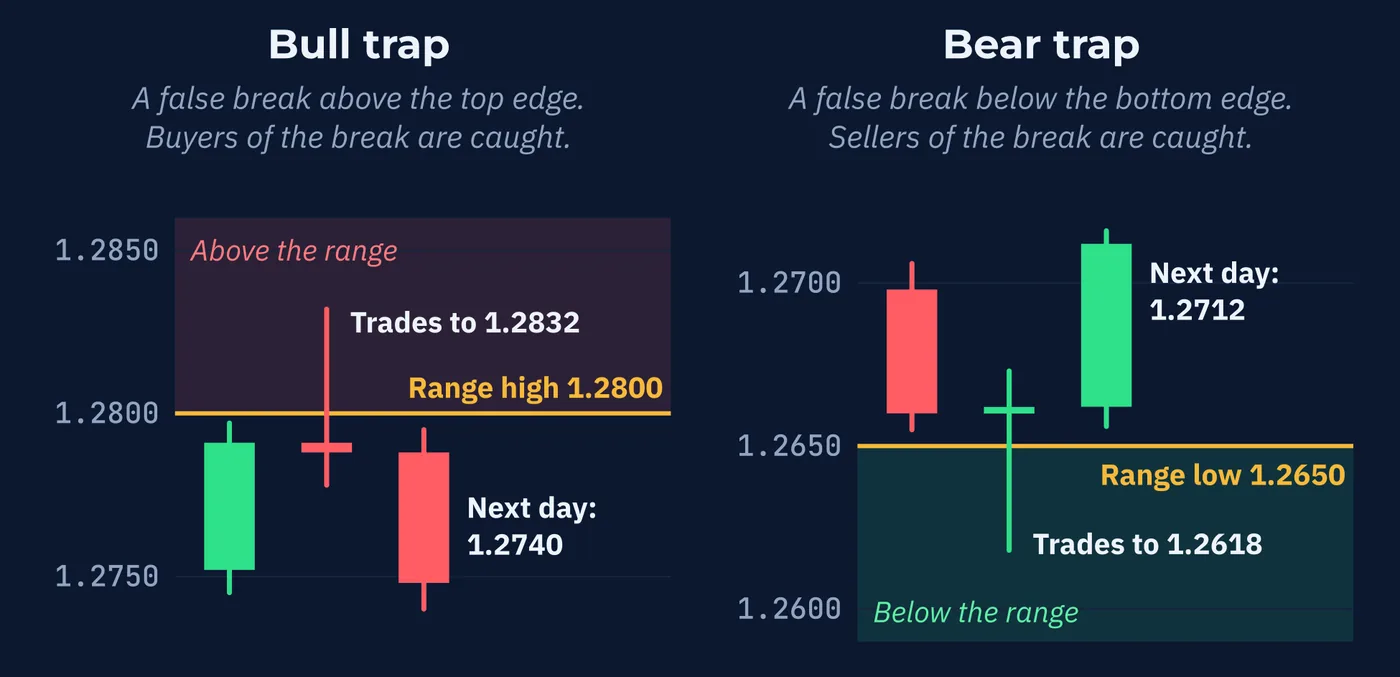
inside.
This is the practical reason to choose a convention before price reaches the edge. The closing convention would have kept a trader out of this trap. It would also have made that trader late for every break that turned out to be real.
The reasoning in Section 5 suggests why traps are common. The stops stored above the top edge are orders to buy. When price reaches them they lift it a little further. If no new buying follows, there is nothing left to hold it up, and price falls back inside.
9A Pause or a Turning Point?
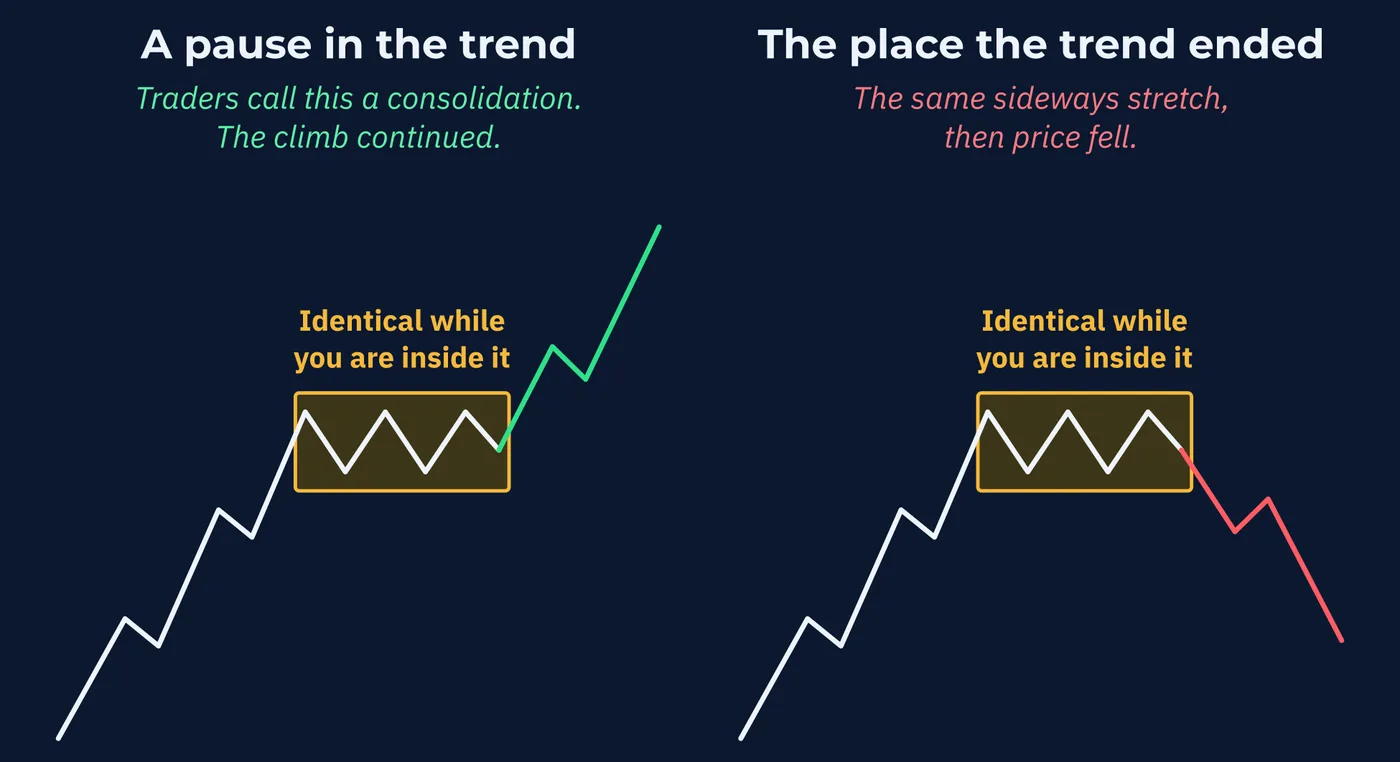
A range can form in two very different places, and they look identical while you are inside them.
One is a pause inside a trend. Price climbs, moves sideways for a while, then climbs again. Traders call this a consolidation. The other is the place a trend ends. Price climbs, moves sideways, then falls.
Which one you are in is only clear after price leaves. It is the pullback question from Lesson 56, stretched over a longer period. A larger timeframe can add context, since a range on an hourly chart may be a small pullback in a daily uptrend. But context is not an answer. Lesson 58 looks at how markets move between trends and ranges, and Lesson 60 looks at timeframes.
10Consolidations Come in Shapes
A range with two level edges is the simplest sideways shape, and chart books call it a rectangle. Edges are not always level. Draw the trend lines from Lesson 56 along the highs and along the lows of a sideways stretch, and you get one of a small family of shapes.
| Shape | Top Edge | Bottom Edge |
|---|---|---|
| Rectangle | Level | Level |
| Symmetrical triangle | Falling | Rising |
| Ascending triangle | Level | Rising |
| Descending triangle | Falling | Level |
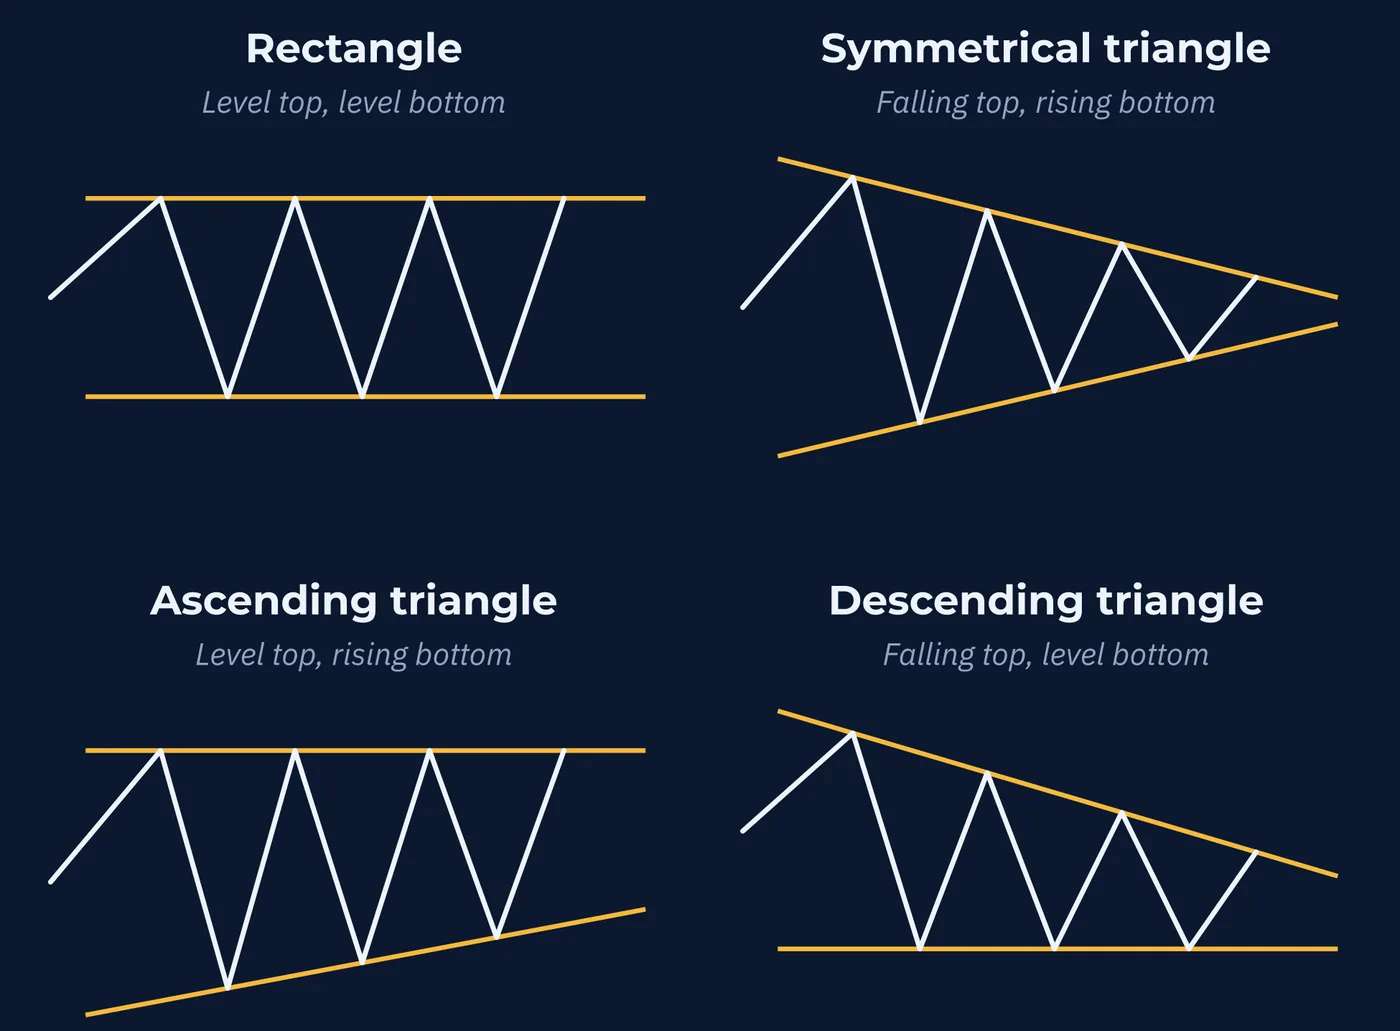
In all three triangles the edges close in on each other, so each swing is smaller than the one before it. The range is narrowing. The point where the two edges would meet is called the apex.
Here is an ascending triangle in numbers, on an illustrative EUR/USD chart.
| Swing | Low | High | Height |
|---|---|---|---|
| First | 1.0810 | 1.0898 | 88 pips |
| Second | 1.0842 | 1.0902 | 60 pips |
| Third | 1.0868 | 1.0900 | 32 pips |
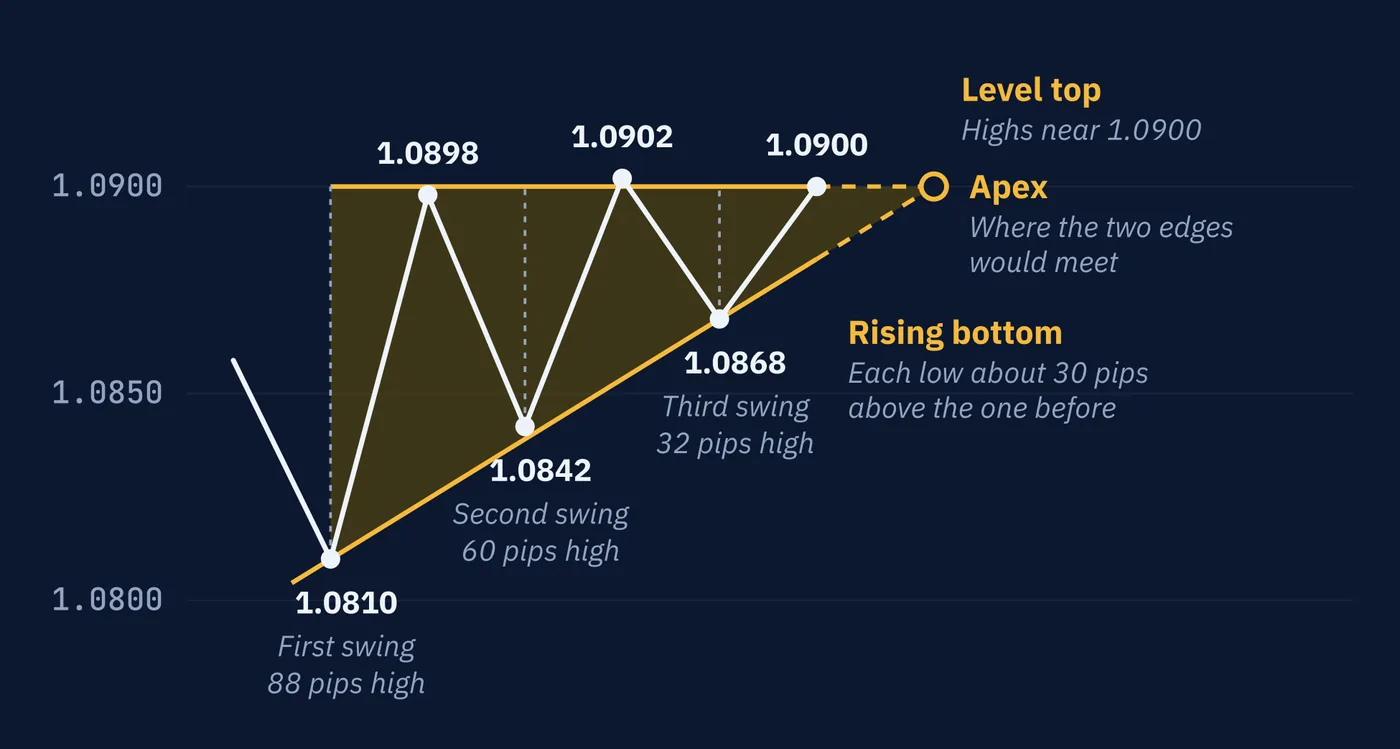
swing is shorter than the last.
The highs are level near 1.0900. The lows rise by about 30 pips each time. Each swing has less room than the last, and at this rate the fourth has almost none. A triangle cannot go on narrowing forever, which is the one thing its shape does tell you.
Two more names describe small, brief consolidations that follow a sharp move. The sharp move is called the flagpole. A flag is a short, narrow channel that tilts against the move before it. A pennant is a small symmetrical triangle.
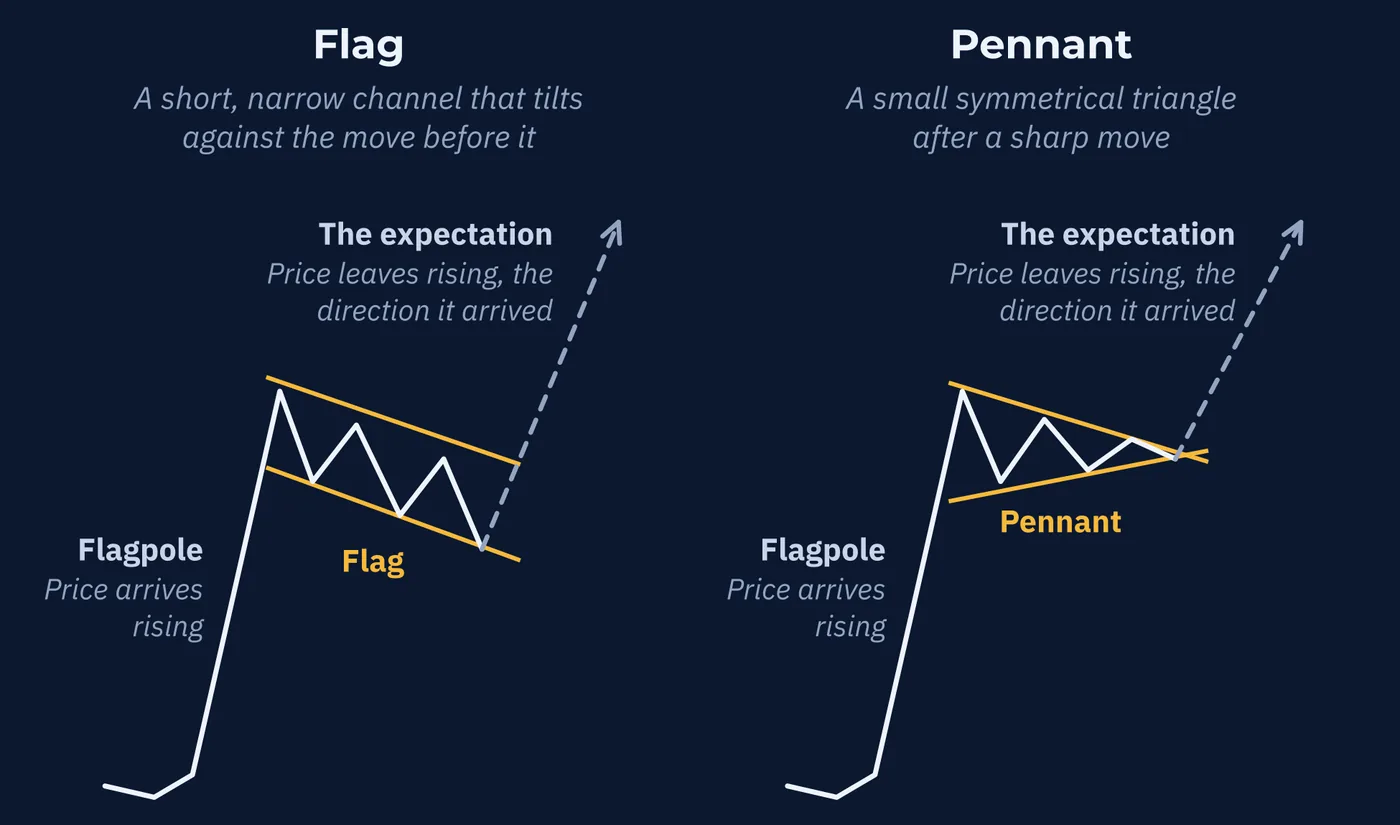
continuation chart books expect, not a forecast.
Chart books file flags and pennants under continuation patterns, meaning price is expected to leave them in the direction it arrived. Many say the same of an ascending triangle in an uptrend. Treat those as claims to be tested, not rules. Section 9 still applies. The shape is only finished once price has left it, and nothing inside it settles the side. Lesson 77 comes back to chart patterns and the evidence for them.
What the names are good for now is description. A three-week ascending triangle under 1.2800, 90 pips wide at its start, tells another trader exactly what you are looking at.
11How Often Do Markets Range?
You will run into confident figures for this. Markets range 70 percent of the time, or 80, or two-thirds. The number is repeated so often that it sounds established.
It is not. There is no agreed source behind a single figure, and there cannot be one, because the answer depends entirely on choices someone made first. Which pair. Which timeframe. What size of swing counts. How level the highs must be to count as level. Change any of those and the percentage changes. The same rules applied to EUR/USD and to an exotic pair would give different answers, and a five-minute chart would give a different answer again.
Trends and ranges are two of the states a market can be in. The next lesson adds a third, and looks at how markets move from one to another.
Three Things to Remember
Try This
Twenty-five minutes with one chart.
Words From This Lesson
| Term | What It Means |
|---|---|
| Range | A period when price moves back and forth between a roughly level high and a roughly level low. |
| Range high and low | The top and bottom edges of a range, which act as resistance and support. |
| Width | The distance between the edges of a range, usually measured in pips. |
| Consolidation | A range that forms as a pause inside a trend, before the trend continues. |
| Volatility clustering | The documented tendency for large price changes to follow large ones and small changes to follow small ones. |
| Midpoint | The price halfway between the edges of a range. |
| Breakout | A move out of a range through one of its edges. A break below is also called a breakdown. |
| False break | A move through the edge of a range or level that quickly returns inside. Also called a fakeout. |
| Bull trap | A false break above the top edge, which catches traders who bought it. |
| Bear trap | A false break below the bottom edge, which catches traders who sold it. |
| Rectangle | A range with a level top edge and a level bottom edge. |
| Triangle | A sideways stretch whose edges close in on each other. Symmetrical, ascending or descending. |
| Flag | A short, narrow channel after a sharp move, tilted against that move. |
| Pennant | A small symmetrical triangle after a sharp move. |
Test Your Knowledge
Ten questions. Answer them all before checking the key on the following pages. If a question gives you trouble, the answer key tells you which section to revisit.
- A. A trend that is moving slowly
- B. Price moving back and forth between a roughly level high and a roughly level low
- C. The distance a pair moves in one day
- D. Any chart with no news events
- A. When the pair typically moves far less than 150 pips a day
- B. Always, since 150 pips is a large number
- C. When the pair typically moves more than 150 pips a day
- D. Only on weekly charts
- A. 1.1100, and 120 pips
- B. 1.1100, and 60 pips
- C. 1.1120, and 120 pips
- D. 1.1080, and 120 pips
- A. Take-profit orders only
- B. Nothing, because orders are only placed at the edges
- C. Central bank interest rate decisions
- D. Stop-loss orders from traders acting inside the range
- A. The idea that every range ends in a large move
- B. Prices gathering at round numbers
- C. Several pairs moving at the same time
- D. The tendency for large price changes to follow large ones and small changes to follow small ones
- A. It will break from the side with more touches
- B. Nothing, because a range is the market in balance
- C. It will break upward, because ranges are pauses
- D. It will break from the side nearest a round number
- A. A retest
- B. A bear trap
- C. A bull trap
- D. A flag
- A. A pause, because ranges always continue the trend
- B. It cannot be known until price leaves the range
- C. The end, because the trend stopped making higher highs
- D. A pause, as long as the range is narrow
- A. A rectangle
- B. A symmetrical triangle
- C. An ascending triangle
- D. A descending triangle
- A. Accept it, since the figure is widely repeated
- B. Assume the true figure is lower
- C. Ask how they defined a range, because the figure depends entirely on that
- D. Assume it applies only to currencies
Answer Key
Each answer explains why the correct choice is correct, why the others are not, and where to reread.
Question 1 · correct answer B
A range is price moving back and forth between a roughly level high and a roughly level low. It is the most common form of the neither reading from Lesson 56.
A is still a trend if it makes higher highs and higher lows, however slowly. C describes daily movement. D has nothing to do with chart structure.
Review: Section 1, Neither Up Nor Down
Question 2 · correct answer A
Width means most when compared with how far the pair usually moves. If the pair typically covers far less than 150 pips a day, crossing the range takes several days.
B ignores the comparison entirely. C describes when the same range would be narrow. D invents a timeframe rule.
Review: Section 3, Describing a Range in Numbers
Question 3 · correct answer A
Add the edges and divide by two: 1.1040 plus 1.1160 is 2.2200, and half of that is 1.1100. The width is 1.1160 minus 1.1040, which is 120 pips.
D and C have the right width but put the midpoint 40 pips from one edge and 80 from the other. B has the right midpoint but gives the distance from the midpoint to an edge, which is half the width.
Review: Section 4, The Midpoint
Question 4 · correct answer D
Traders who sell near the top often place stops just above it, and traders who buy near the bottom place stops just below it. The longer the range lasts, the more can pile up.
A describes orders that sit at the edges rather than beyond them. C is unrelated to range structure. B ignores the protective stops placed outside the edges.
Review: Section 5, What Builds Up Outside a Range
Question 5 · correct answer D
Volatility clustering is the documented tendency for large changes to follow large ones and small changes to follow small ones. It is why calm periods tend to stay calm on average.
A is the coiled-spring idea, which clustering actually pushes against. C describes correlation, covered in Series I. B describes order clustering from Lesson 55.
Review: Section 6, Quiet Tends to Stay Quiet
Question 6 · correct answer B
A range is the market in balance, and nothing inside it announces which way the balance will tip.
A, C, and D each invent a rule. Touches, round numbers, and the earlier trend do not decide the side of the break.
Review: Section 7, How a Range Ends
Question 7 · correct answer C
Price broke above the top edge and came back inside. A false break above the top is a bull trap, because it catches the traders who bought the break.
B is the same thing at the bottom edge. A is a return to a level that has already broken and held, which this one did not. D is a small consolidation after a sharp move.
Review: Section 8, False Breaks and Their Names
Question 8 · correct answer B
A pause inside a trend and the place a trend ends look identical while price is inside the range. Which one it was only becomes clear after price leaves.
A and D each assume one outcome. C jumps ahead. Under Lesson 56's definition, an uptrend ends when its last higher low breaks, and a missing new high is only a warning.
Review: Section 9, A Pause or a Turning Point?
Question 9 · correct answer C
A level top with a rising bottom is an ascending triangle. The lows climb toward a top edge that stays where it is.
A has two level edges. B has a falling top and a rising bottom. D is the mirror image, with a falling top and a level bottom.
Review: Section 10, Consolidations Come in Shapes
Question 10 · correct answer C
There is no agreed source for a single figure. The answer changes with the pair, the timeframe, and what counts as a range, so the definition is the first thing to ask about.
A treats repetition as evidence. B and D replace one unsupported claim with another.
Review: Section 11, How Often Do Markets Range?
Keep going
Reading Price Structure is written by Kanin D. Alldredge for The Currency Classroom, and it is free to read. There is more free from CNS: start here.
Start free with CNS →