What Each Approach Is Good At

1The Weighing Nobody Did
Most trading education focuses heavily on one approach: technical analysis. Lesson 53 explained why, and the reasons turned out to be about teaching rather than about results.
So the weighing never happened. Here it is.
It will not end in a ranking, and that is not an evasion. A ranking would require all five to be answering the same question, and they are not.
2Tools and Questions
Ask whether a hammer is better than a tape measure and the question dissolves. They do different jobs. You can still use either one badly, and one way to use a tape measure badly is to try driving a nail with it.
The five approaches work the same way. Each one answers a particular kind of question well. Each one is close to useless on the others. Every approach fails the same way: asked something it was never able to answer.
So the useful question is not which approach is best. It is which question you are actually asking, and whether the thing you are looking at can answer it.
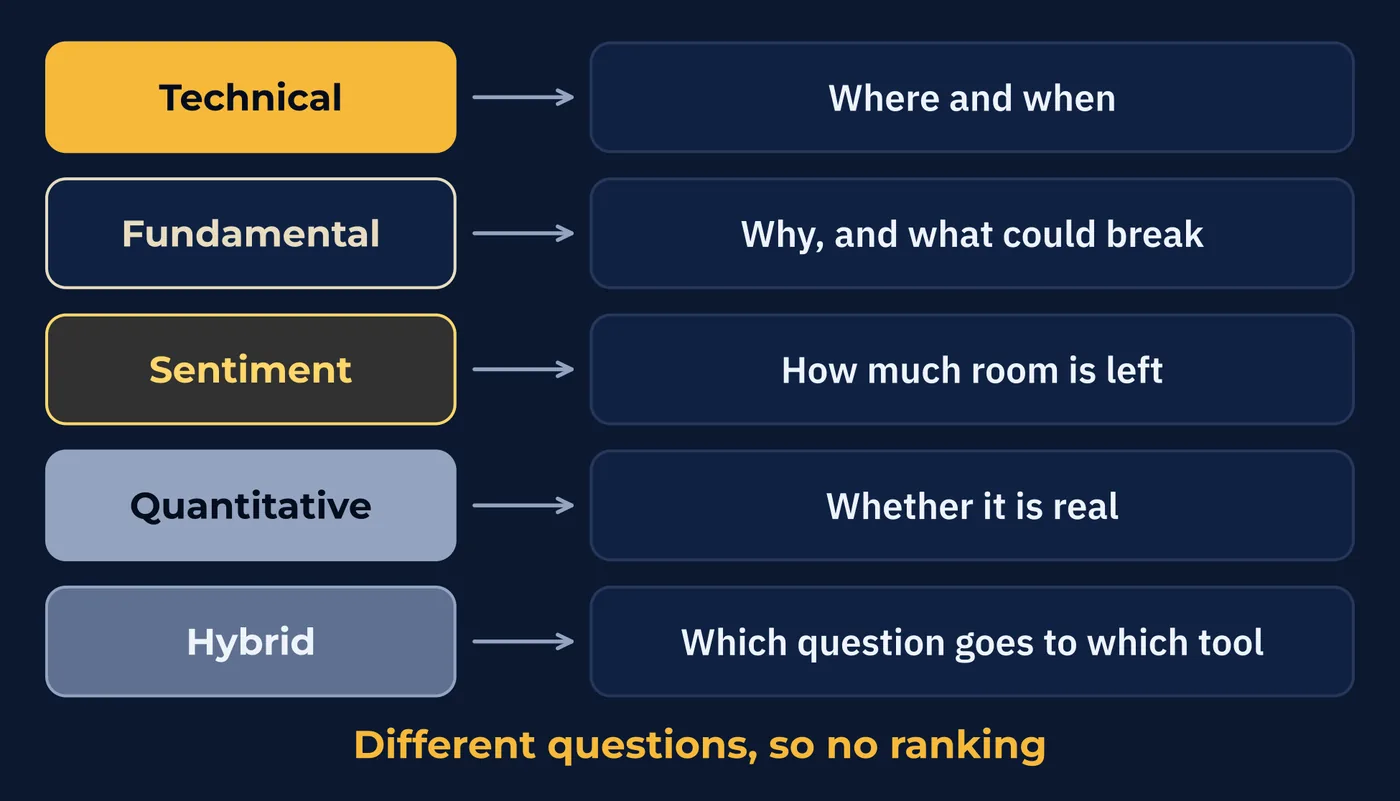
Five approaches follow, each with what it answers and what it cannot.
3Technical Analysis
Answers well: where and when. Where a level sits, where a move has run out of room, where your idea would be proven wrong, and when a condition you were waiting for has arrived.
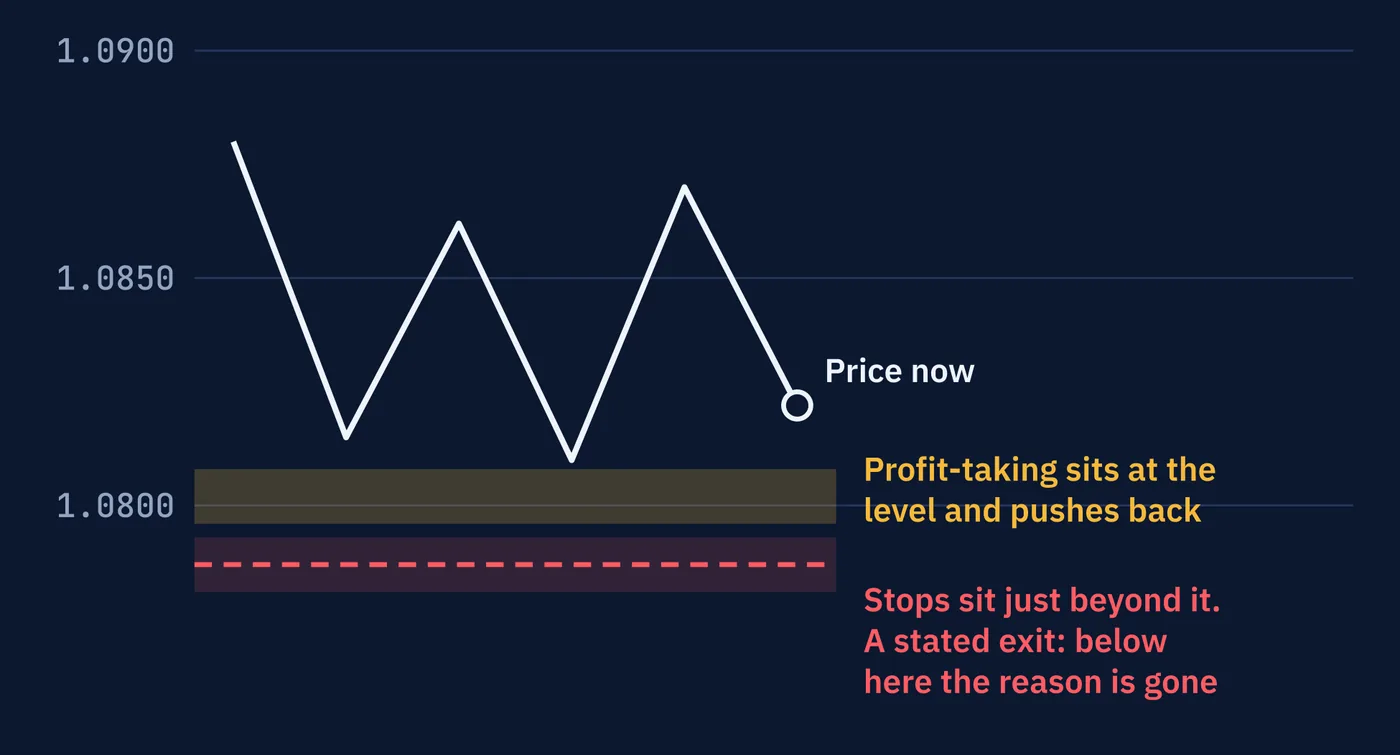
A chart gives you a specific price at which your reason no longer holds. Lesson 52 made the case that your approach decides your exit, and this is the approach that states the exit as a number before you enter.
There is also a documented reason levels behave as they do. A study by Carol Osler of the Federal Reserve Bank of New York, using actual order records at a large currency dealing bank, found that both profit-taking orders and stop orders cluster heavily at round numbers, which are the same prices traders draw as support and resistance. Profit-taking sits at the level and pushes back against the move. Stops sit just beyond it and accelerate the move once they trigger.
Cannot answer: why, or whether. A chart records what happened. It does not tell you what caused it, and it cannot tell you whether a move will continue, because a pattern that formed a thousand times before carries no promise about the thousand and first.
4Fundamental Analysis
Answers well: why, and what could break. Why one currency has strengthened over two years, what regime you are operating in, and which event would change the whole picture rather than a day of it.
Series F and G were this approach doing its job. A peg breaking, a reserve currency's position, a gold window closing. None of that was a trade. All of it was an explanation of why the board looks the way it does.
Cannot answer: when. And there is a harder version of that, which this course is not going to skip.
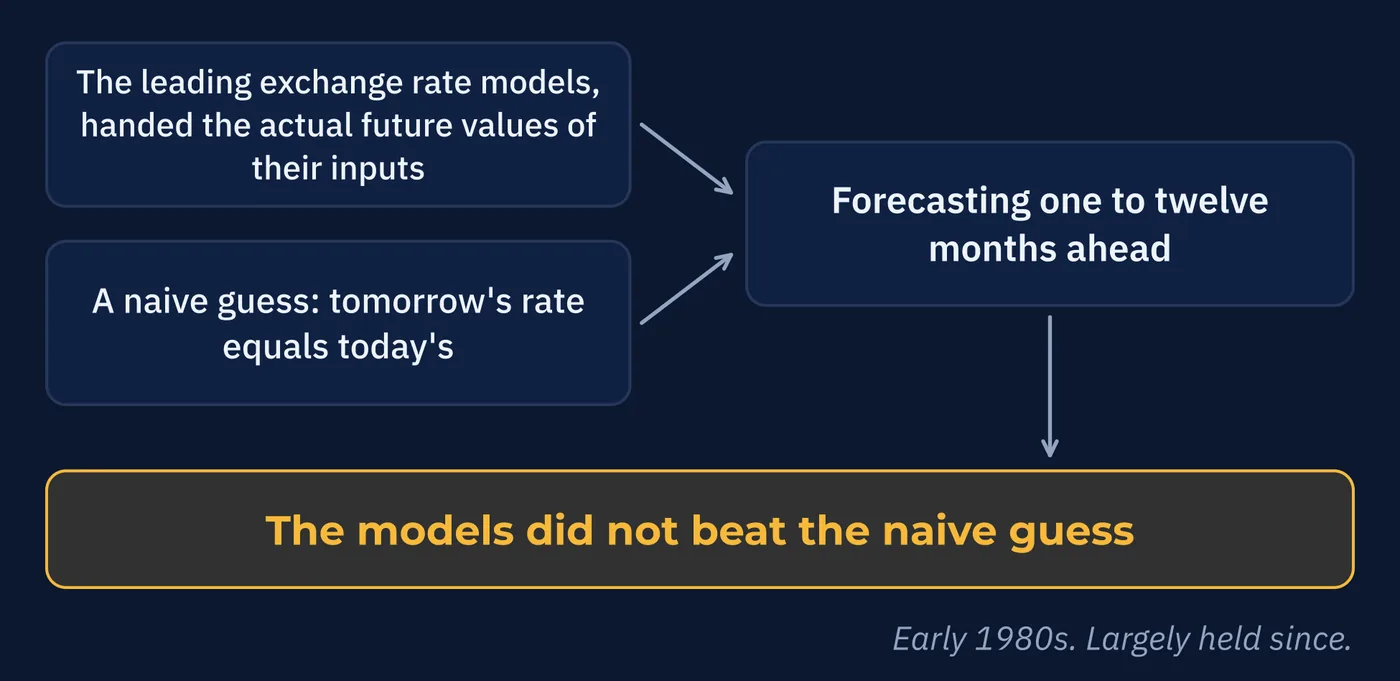
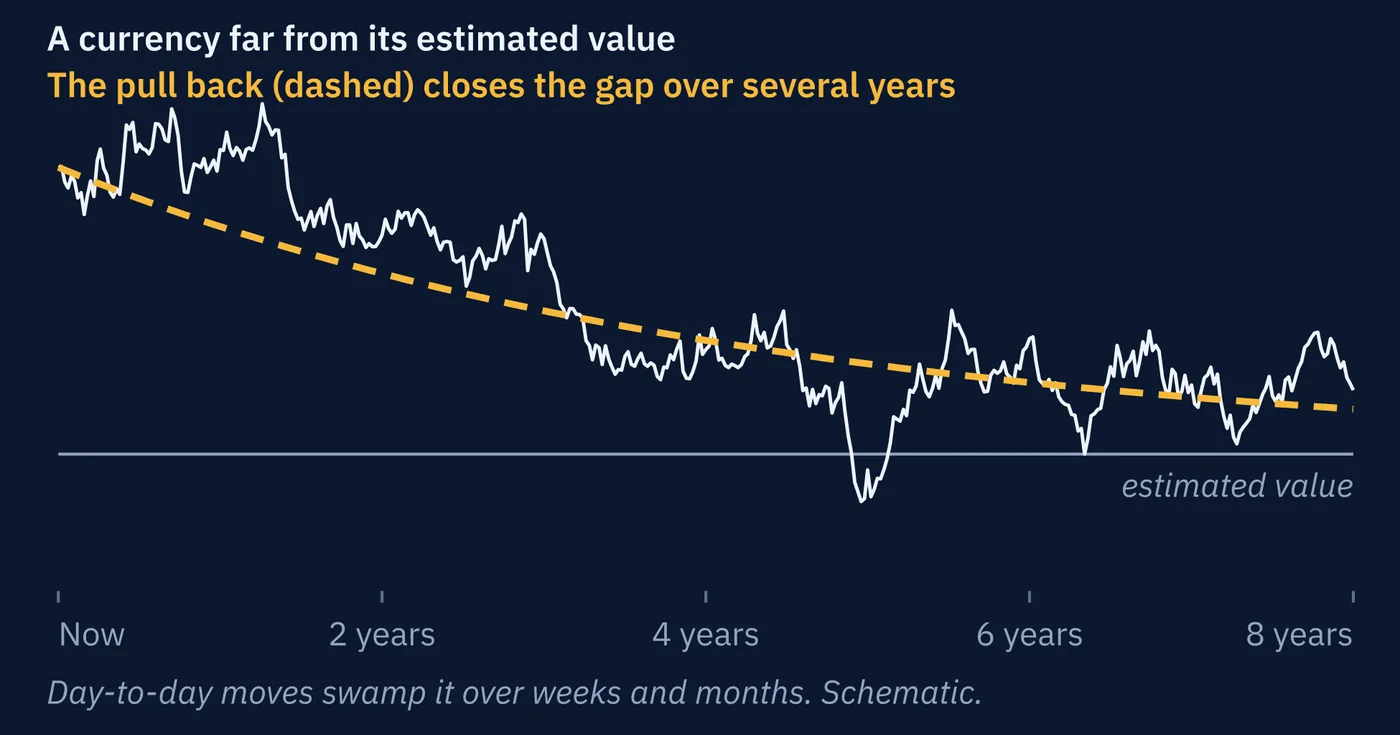
The resolution is not that economics is useless. Economic forces do bind, but slowly. Estimates of how long it takes a currency to work off a valuation gap run to several years. That is far too slow to be a trade and exactly right for knowing what you are standing in.
5Sentiment Analysis
Answers well: how much room is left. If most participants have already bought, the buying that would drive price higher has largely happened, and the holders are all potential sellers.
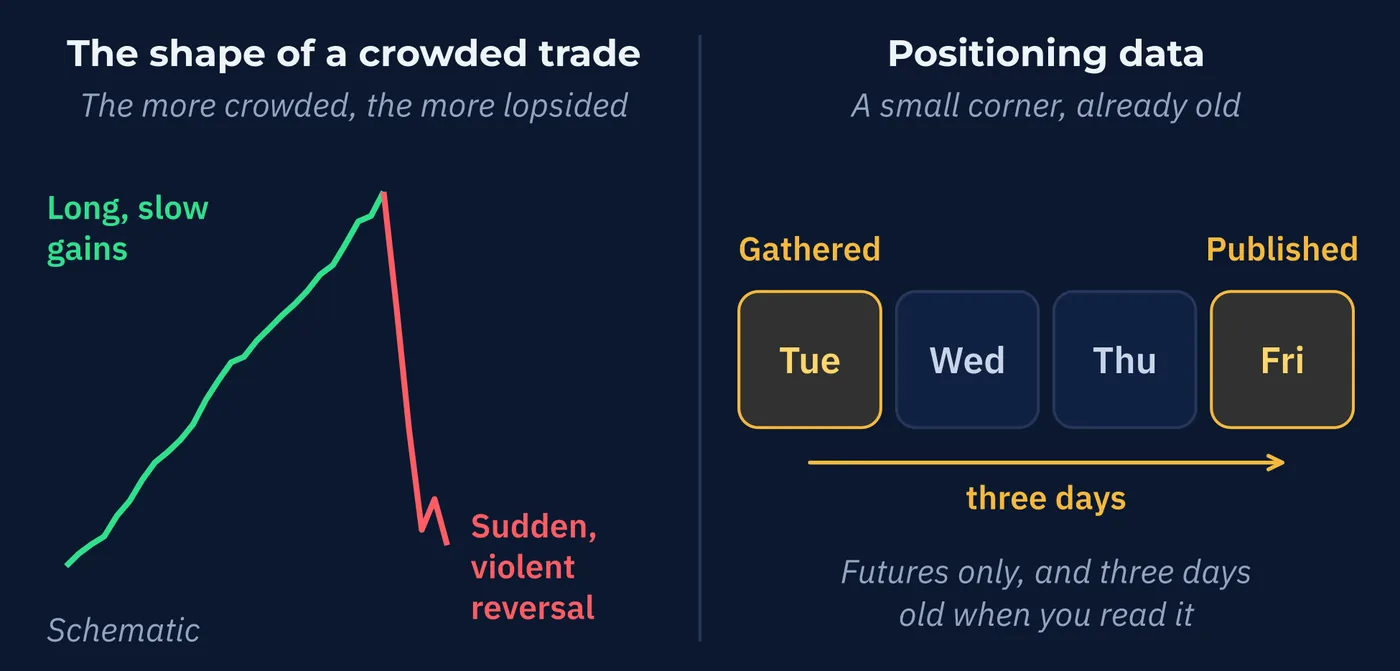
It is also the best available read on crash risk. Research into currencies with high interest rates found that the more crowded the position, the more lopsided the eventual move, with long slow gains and sudden violent reversals. Adding more currencies did not diversify that away, which suggests the unwinds happen together. Series Q returns to this with the carry trade.
Cannot answer: when, and in some ways what. Crowded can stay crowded for a year. And the main published positioning data covers currency futures only, which is a small corner of a market that Lessons 40 and 41 established has no central record at all.
It is also old by the time you read it. The figures are gathered on a Tuesday and published on the Friday. Lesson 99 goes through what that rules out.
6Quantitative Analysis
Answers well: whether something is real. It is the only one of the five whose entire purpose is checking, and it is the only defense against the fact that a convincing story and a working method look identical from the outside.
Cannot answer: anything about a situation that has not happened before. Note this:
The tool built to detect false edges is the best tool for producing them.
Researchers have shown that if you test ten strategies that are genuinely worthless, you should expect the best of the ten to look good. Not marginally good. Good enough that most people would trade it. Test a few hundred and the best one looks excellent.
They demonstrated it by searching tens of thousands of variations of a simple rule on simulated prices that were pure randomness, containing nothing to find. The winner looked statistically convincing.
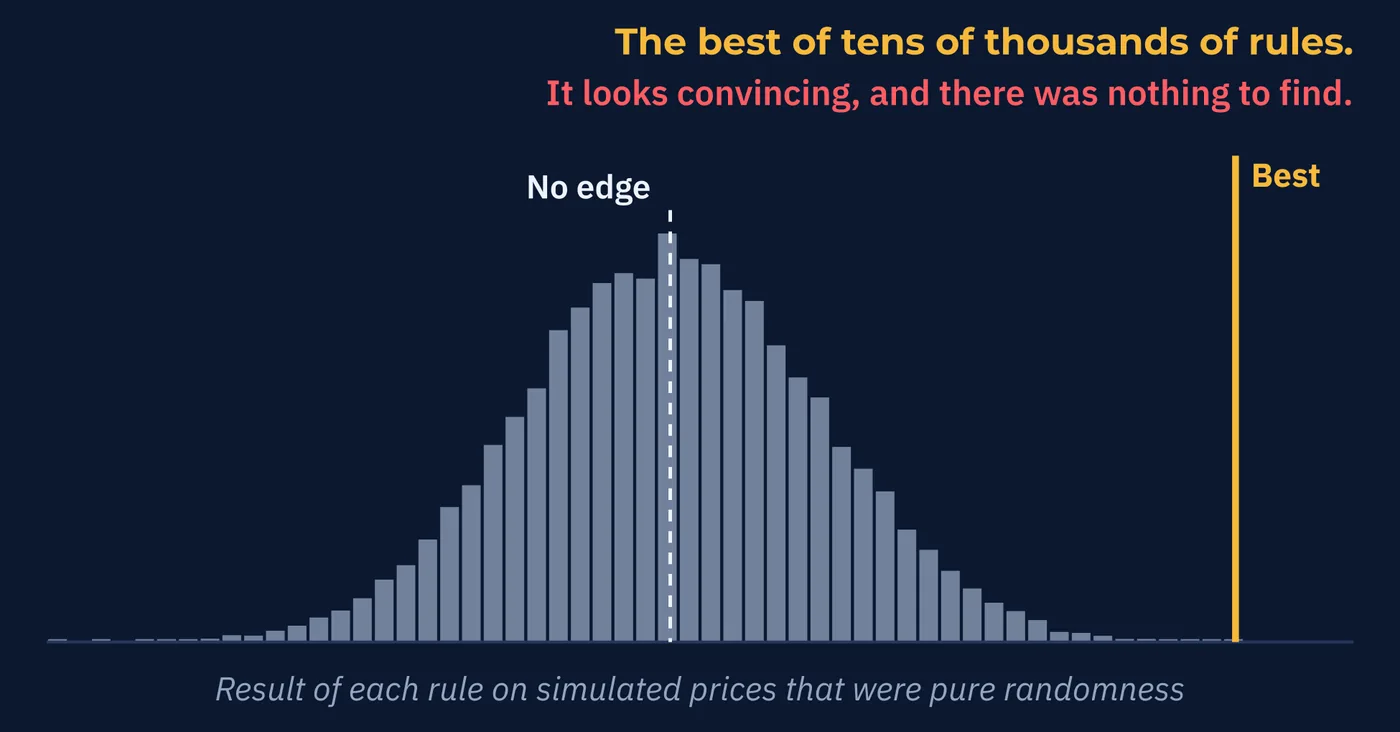
Same arithmetic, both directions. The difference between quantitative analysis catching a fake edge and creating one is whether the person counted how many things they tried. Series U is built on this, and Lesson 110 applies it to automated systems.
7Hybrid Analysis
Answers well: the allocation problem. Once you accept that each approach answers one kind of question, the obvious move is to route each question to whatever answers it. Fundamentals for the regime, technicals for the level and the exit, positioning for how stretched things are, and testing for whether any of it holds up.
Most professional discretionary traders work roughly this way, and it is a reasonable division of labor rather than a clever trick.
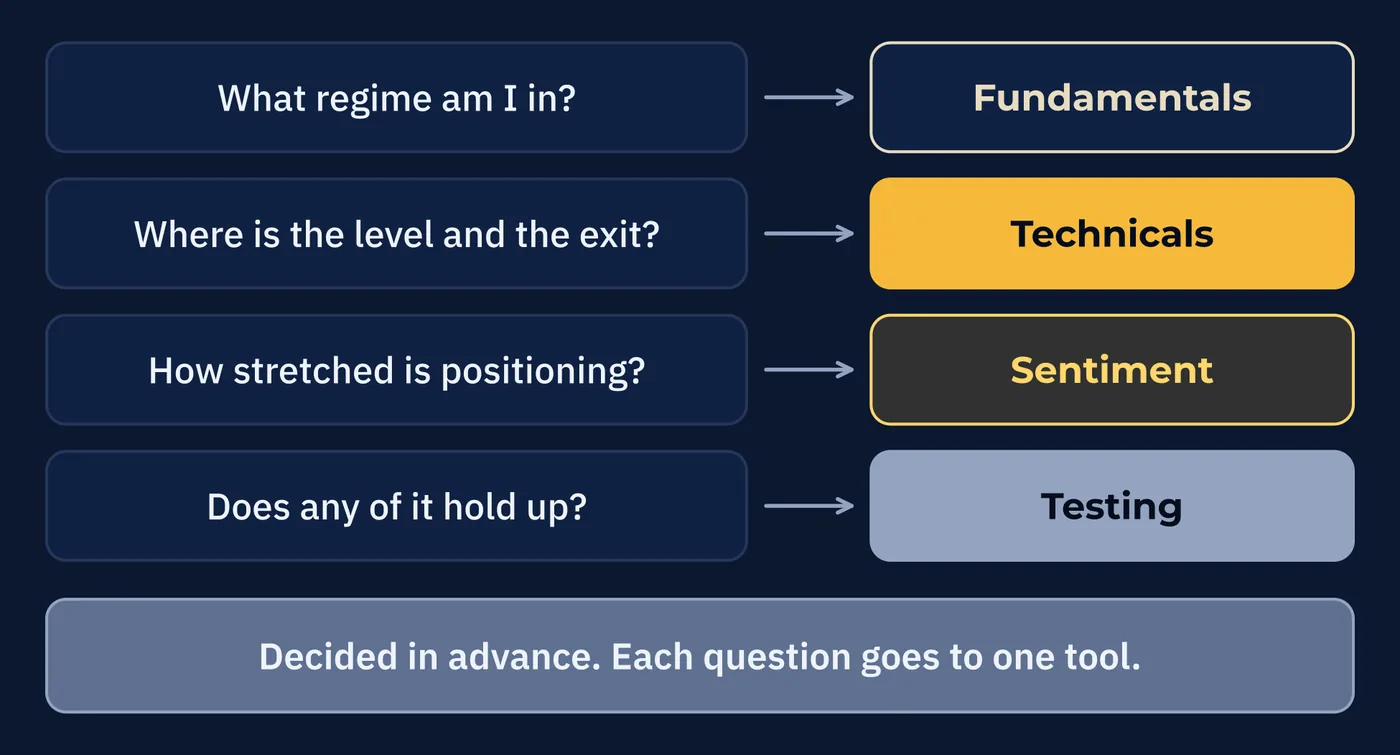
Cannot answer: the question of its own honesty. Lesson 52 named the failure mode. Deciding in advance which approach answers which question is analysis. Consulting them one after another until something agrees with you is not, and from the inside the two feel the same.
Hybrid is the only one of the five whose blind spot is the person using it.
8All Five on One Page
| Approach | Answers Well | Cannot Answer |
|---|---|---|
| Technical | Where and when. States your exit as a price before you enter. | Why anything is happening, or whether a move continues. |
| Fundamental | Why, what regime you are in, and what could break it. | When. Forecasting the next move has defeated it for more than forty years. |
| Sentiment | How much room is left, and where crash risk is building. | When. Crowded stays crowded, and the data is partial and stale. |
| Quantitative | Whether a thing is real rather than a good story. | Anything new. And it fakes edges as easily as it catches them. |
| Hybrid | Which question goes to which tool. | Whether you are being honest with yourself. |
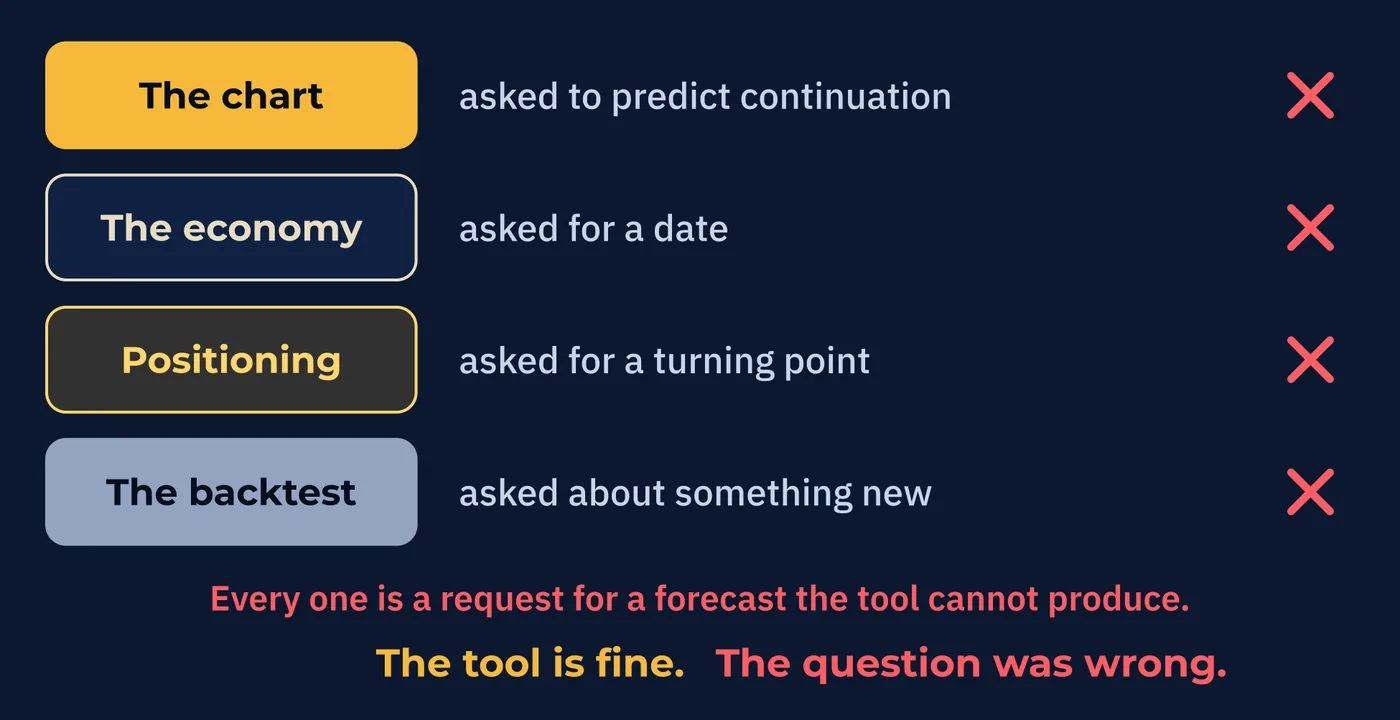
Read down the third column and the shared mistake is obvious. Every approach fails when it is asked for a forecast it was never able to produce.
The chart asked to predict continuation. The economy asked for a date. Positioning asked for a turning point. The backtest asked about a situation nobody has seen. In each case the tool is fine and the question was wrong.
This series set out to give you a map, and that is now done. What it has not done, and will not do, is tell you which approach to take. That depends on the hours you have, the temperament you have, and what you can actually hold yourself to, none of which this course knows about you.
Three Things to Remember
Try This
Thirty minutes, and step four is where it goes wrong on purpose.
Words From This Lesson
| Term | What It Means |
|---|---|
| Regime | The broad conditions a currency is operating under, such as whether it floats freely, whether rates are rising, and what its central bank is trying to do. |
| Crowding | A condition where a large share of participants hold the same position, leaving little buying or selling left to come and plenty of holders who may exit together. |
| Benchmark | The simplest alternative a method must beat to be worth using. For currency forecasting it is the assumption that tomorrow's rate equals today's. |
| Trial count | How many versions of an idea were tested before one was reported. Without it, a good result cannot be interpreted. |
| Blind spot | A question an approach is structurally unable to answer, as opposed to one it answers badly. |
Test Your Knowledge
Eight questions. Answer them all before checking the key on the following pages. If a question gives you trouble, the answer key tells you which section to revisit.
- A. Ranking them would be unfair to beginners
- B. The evidence is too weak to support any ranking
- C. They answer different kinds of question, so a ranking has nothing to compare
- D. Professional traders disagree about the order
- A. Most orders are placed by retail traders
- B. Levels only matter on higher timeframes
- C. Stop orders are usually filled at better prices than expected
- D. Profit-taking and stop orders both cluster at round numbers
- A. It shows that both buyers and sellers use the same charts
- B. Profit-taking pushes back at the level while stops beyond it accelerate a break
- C. It proves large participants hunt retail stop orders
- D. It explains why spreads widen at round numbers
- A. The models beat the naive benchmark at every horizon
- B. The models worked at twelve months but not at one
- C. The test was never completed
- D. The models still failed to beat the assumption that tomorrow equals today
- A. The forces only apply to pegged currencies
- B. The data required is not publicly available
- C. The adjustment takes years, which is far slower than any trade
- D. Central banks prevent the adjustment from occurring
- A. It covers futures only, and is several days old when published
- B. It covers only large participants
- C. It is expensive to access
- D. It is published without the trader categories
- A. Because testing many worthless ideas will produce one that looks good
- B. Because backtesting software is unreliable
- C. Because historical data contains errors
- D. Because quantitative traders use more leverage
- A. Relying on data that is published with a delay
- B. Being asked for a forecast the approach was never able to produce
- C. Using timeframes that are too short
- D. Ignoring transaction costs
Answer Key
Each answer explains why the correct choice is correct, why the others are not, and where to reread.
Question 1 · correct answer C
A ranking requires all five to be answering the same question. They are not. Technical answers where and when, fundamental answers why, sentiment answers how much room is left, and quantitative answers whether a thing is real.
A treats the refusal as protectiveness, which it is not. B is wrong because the lesson presents substantial evidence; it just does not compare like with like. D is irrelevant, since the reason is structural rather than a matter of opinion.
Review: Section 2, Tools and Questions
Question 2 · correct answer D
Both profit-taking orders and stop orders were found to cluster heavily at round numbers, which are the same prices traders mark as support and resistance.
A is false and the study concerned a dealing bank's order book, not retail share. C is unrelated to the finding and generally untrue of stops. B is a claim about timeframes the study did not make.
Review: Section 3, Technical Analysis
Question 3 · correct answer B
Profit-taking sits at the level and works against the prevailing move, which is why price stalls and turns there. Stops sit just beyond and accelerate the move once triggered, which is why breaks run.
A is true but explains nothing about the mechanism. C adds intent the evidence does not support and that Lesson 43 specifically argued against. D describes a different phenomenon that this finding does not address.
Review: Section 3, Technical Analysis
Question 4 · correct answer D
The models were handed the actual future values of inflation, money supply and the rest, so they did not have to forecast their own inputs. They still failed to beat the assumption that tomorrow's rate equals today's at one to twelve months.
A reverses the result. B invents a horizon split the result does not contain. C is false; the study was completed, published, and has been revisited for decades.
Review: Section 4, Fundamental Analysis
Question 5 · correct answer C
Estimates of how long a currency takes to work off a valuation gap run to several years. That is useful for knowing what conditions you are in and far too slow to act on as a trade.
A is false, since the adjustment is observed in floating currencies. B is wrong because the relevant data is public. D misstates what central banks do and is not the reason given.
Review: Section 4, Fundamental Analysis
Question 6 · correct answer A
The main published positioning data covers currency futures, a small corner of a market with no central record, and it is gathered on a Tuesday and published on the Friday.
C is wrong because the data is free. B is partly true, since it reports large reportable positions, but it is not the limitation the lesson identifies. D is false; the categories are exactly what the report provides.
Review: Section 5, Sentiment Analysis
Question 7 · correct answer A
Testing ten genuinely worthless strategies should be expected to produce one that looks good enough to trade. Researchers demonstrated it with tens of thousands of variations run against pure randomness, and the winner looked statistically convincing.
B blames the software rather than the arithmetic. C is a real problem but a different one and not what makes the result cut both ways. D is unrelated to how edges are detected or manufactured.
Review: Section 6, Quantitative Analysis
Question 8 · correct answer B
Each approach breaks when asked for a forecast it was never able to produce: the chart asked to predict continuation, the economy asked for a date, positioning asked for a turning point, the backtest asked about something new. The tool was fine and the question was wrong.
A applies to positioning data only. C is a choice a trader makes rather than a limit of any approach. D is a real cost covered in Series C, but it is not a failure of analysis.
Review: Section 8, All Five on One Page
Keep going
The Five Approaches is written by Kanin D. Alldredge for The Currency Classroom, and it is free to read. There is more free from CNS: start here.
Start free with CNS →