Why Technical Analysis Dominates Retail

1The First Hundred Hours
Someone decides to learn forex. They search for how to start.
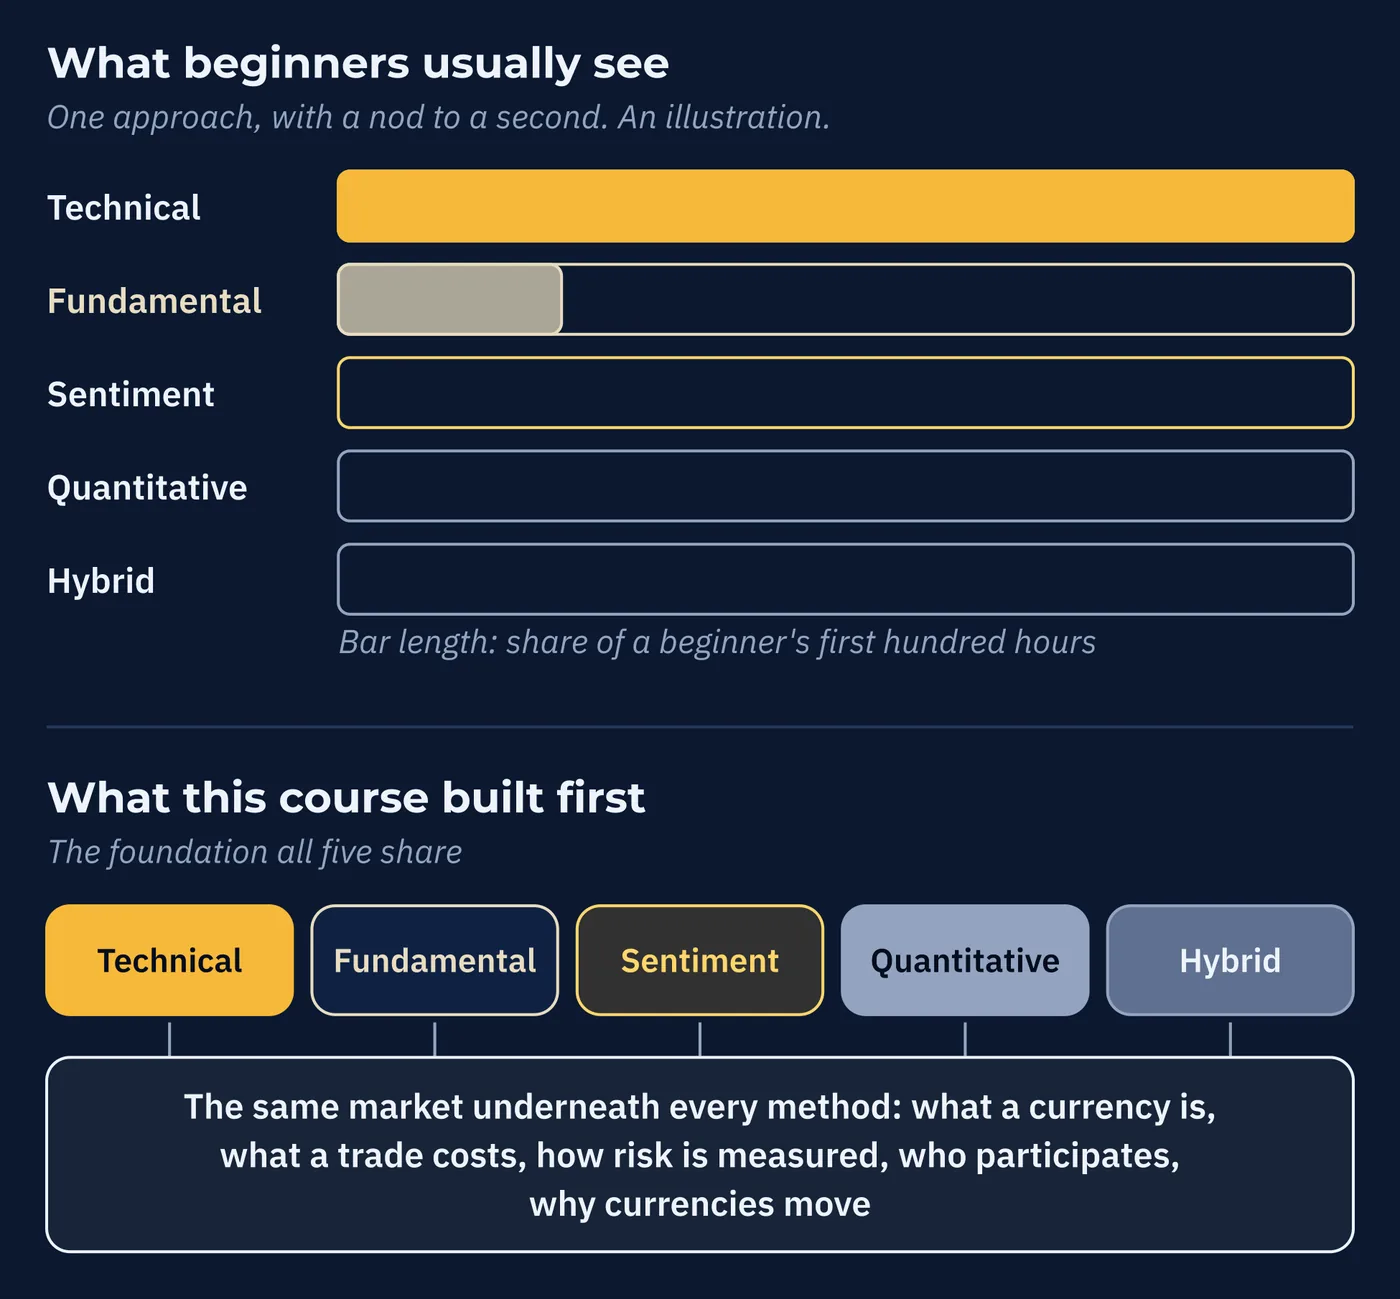
What comes back is charts. Candlestick patterns, support and resistance, moving average crossovers, indicator settings, chart setups, and more charts. Somewhere in there is a short piece about interest rates, usually framed as background rather than as a method.
By the time that person has spent a hundred hours learning, they may have a detailed vocabulary for technical analysis and only a passing familiarity with the other four approaches. They have probably heard terms like fundamental, sentiment, quantitative, and hybrid analysis. They may even have a general idea of what those words mean. But hearing the names is not the same as understanding how each approach reads the market, what information it uses, or how it can become a method for making trading decisions.
This course was built differently on purpose.
It did not begin by handing you a strategy and teaching you how to find entries. It began underneath all of them. What a currency is. Why it has value. How a trade actually works. What it costs. How risk is measured. Who participates in the market. Why currencies move. How central banks, economic data, expectations, correlations, and the structure of the market fit together.
None of that belongs to one trading strategy.
A technical trader can use it. A fundamental trader can use it. A sentiment trader can use it. A quantitative trader can use it. And a trader who combines approaches can use it. Whatever method you eventually choose, the market underneath that method is the same.
That foundation is now in place.
Now it is time to turn toward the material most forex education starts with: charts, price action, indicators, patterns, and the different ways traders try to turn what they see into a repeatable method.
That material is not unimportant. The problem is treating it as though it is the whole subject.
That is not an accident, and it is not a conspiracy either. There are reasons technical analysis dominates beginner forex education, and they are worth understanding, because they tell you something about the information you have been receiving.
You can check the claim rather than take it. Search for beginner forex lessons and look at what the first page offers. Then count how many of the five approaches from Lesson 52 are represented. The answer is usually one, with a nod to a second.
2The Question Worth Asking
There are two different questions here, and almost everybody collapses them into one.
The first: does technical analysis work better than the alternatives?
The second: why is technical analysis the thing beginners are taught?
These have different answers, and they are produced by different forces. The first is a question about markets. The second is a question about how education gets made and paid for.
This lesson answers the second question only.
If the reasons below sound like criticisms, they are not. Every one of them is a genuine practical advantage. They simply are not evidence about performance, which is a separate matter that Lesson 54 handles.

3Price Is Free, and Nearly Universal
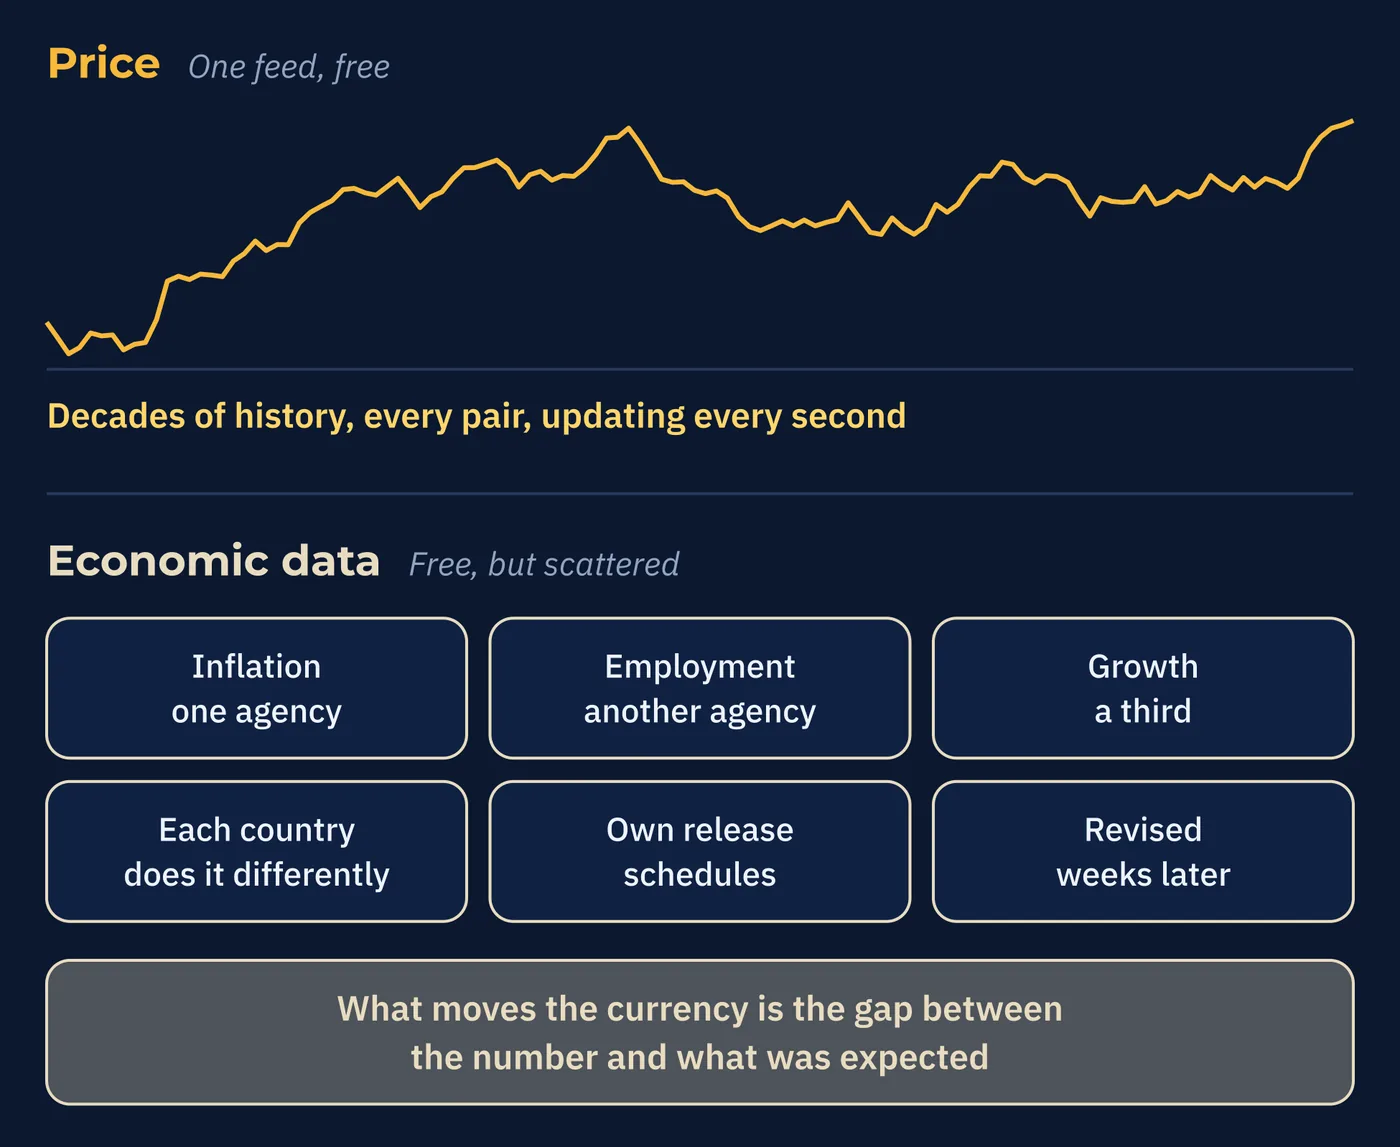
Open any charting package and you have decades of price history at no cost, updating every second, for every pair you could want.
Now try the same with economic data. Inflation comes from one agency, employment from another, growth from a third, and each country does it differently. Releases land on their own schedules. Figures get revised weeks later, sometimes substantially. A number means nothing on its own, because what moves a currency is the gap between the number and what the market expected, and that expectation has to be sourced separately.
None of that is hard for a professional. All of it is a wall for a beginner on day one.
4The Feedback Arrives Immediately
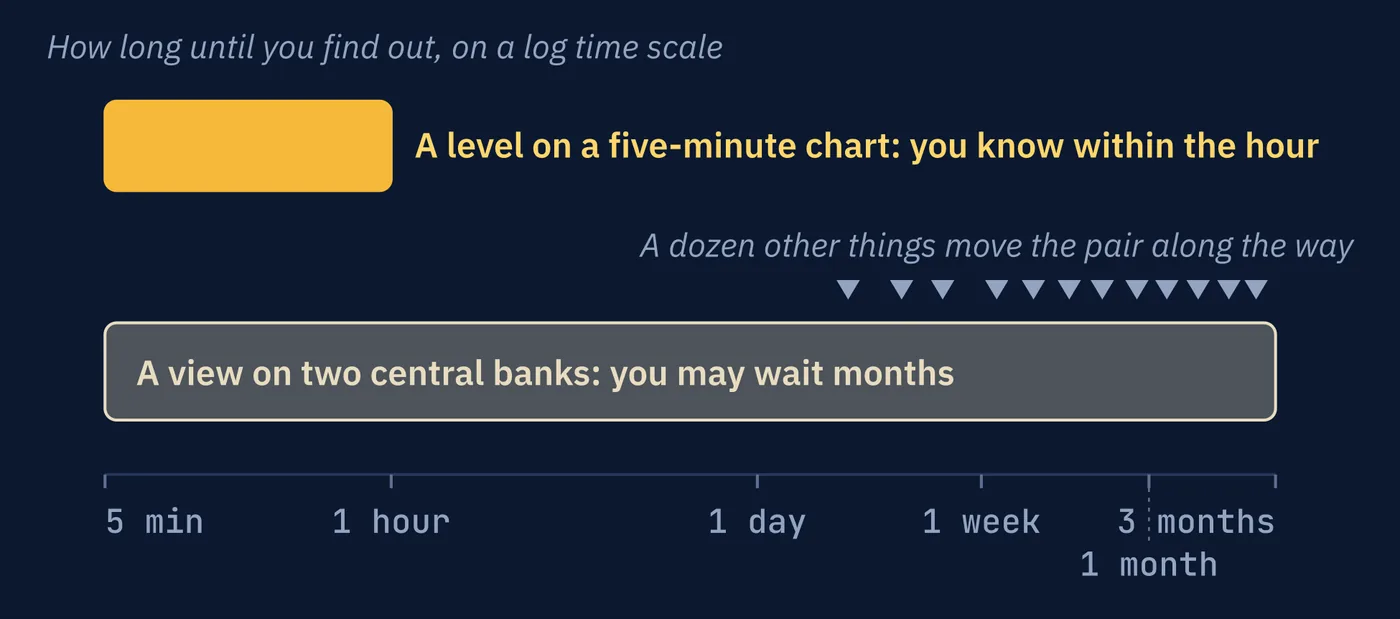
Draw a level on a five-minute chart. Within the hour you know whether price respected it.
Form a view that one central bank will move faster than another, and you may wait months to find out whether you were right, during which a dozen other things will have moved the pair and you will never cleanly know which part of the outcome was your idea.
Fast feedback is enormously attractive to a learner. It feels like progress. It is also the only kind of feedback that fits inside a lesson, a video, or a demonstration.
5It Teaches in Pictures
You can put a chart on a screen, draw a line on it, and the student sees the idea in one glance. The thing being taught and the picture of it are the same object.
Now try to draw capital moving toward a higher yield. You can illustrate it, but the illustration is a metaphor for the idea rather than the idea itself, and the student has to be told what the picture represents.
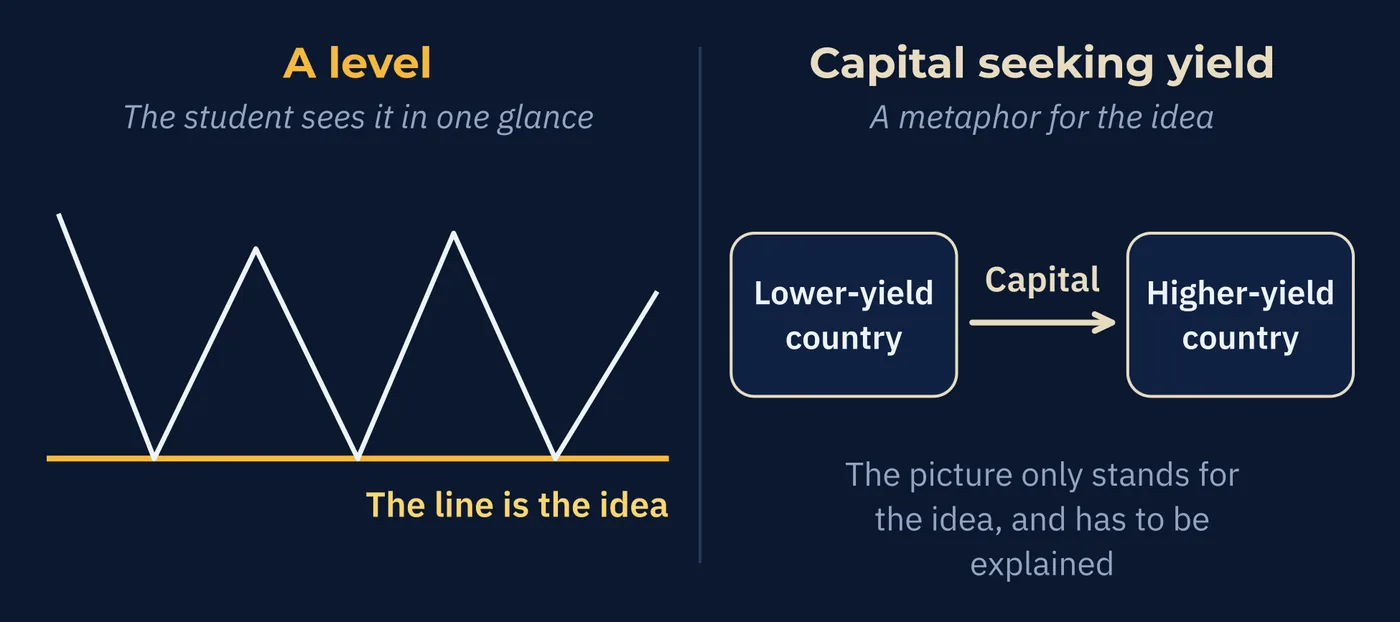
Material that can be shown spreads faster than material that has to be explained. That is true of every subject, not just this one, and it has nothing to do with which material is more useful.
6There Is Always Another One
This is the reason that gets noticed least and explains the most.
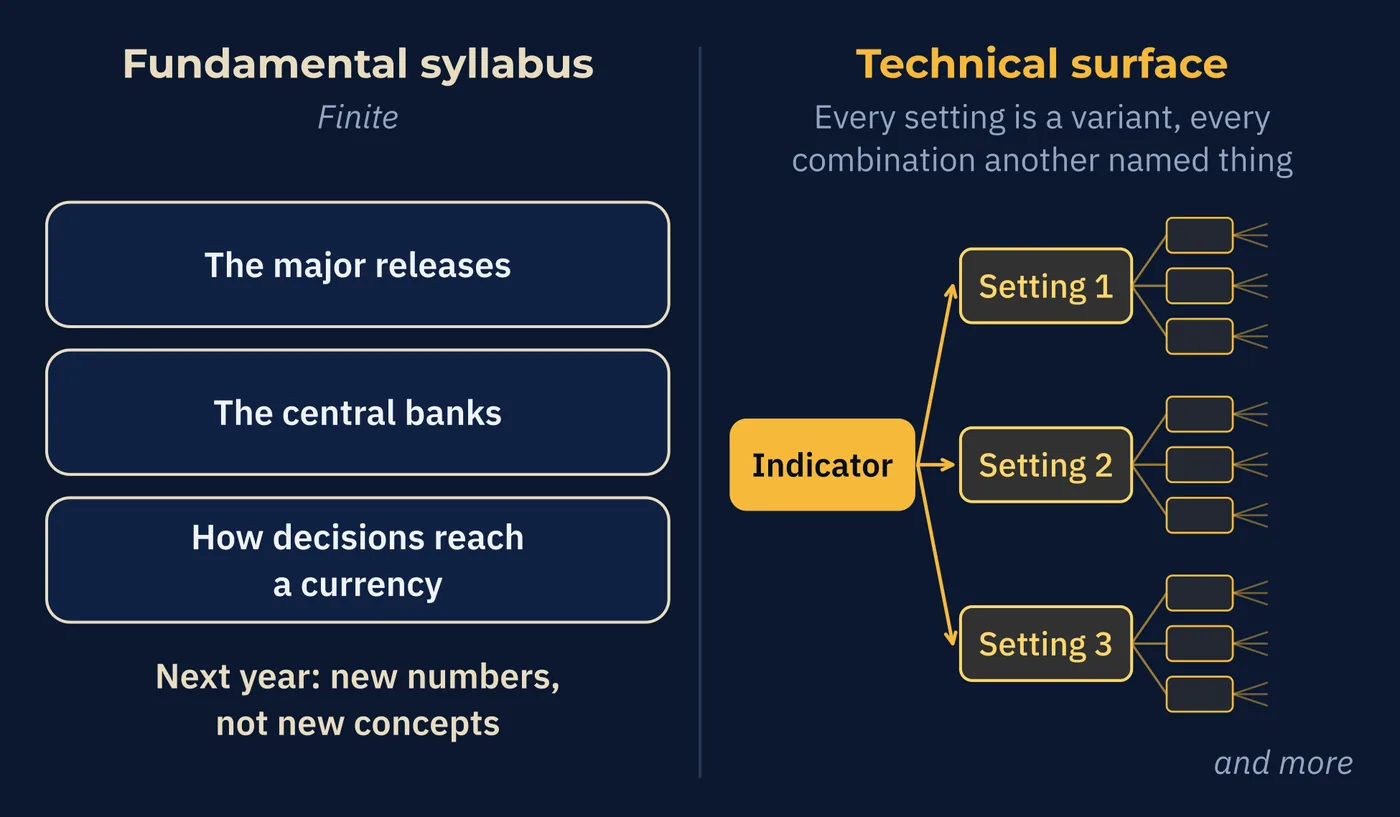
Fundamental analysis has a finite syllabus. There are only so many major economic releases, only so many central banks, and only so many ways their decisions reach a currency. Once you have taught that, you have taught it. Next year brings new numbers, not new concepts.
The technical surface has no such limit. Every indicator has settings, and every setting is a variant. Indicators combine, and every combination is another thing with a name. Patterns can be defined more finely and then more finely again. New ones get invented continually.
One approach runs out of material. The other never does.
For a learner this means there is always something further to study, which can feel like depth and can equally be motion. For anyone producing education there is always something further to produce, which has consequences this course returns to in Series Z.
There is a second, closely related point that is easy to miss. It is not only that the concepts are unlimited. It is that the occasions are.
Open any chart on any pair at any hour and something is happening on it. A level nearby, a trend to describe, an indicator reading worth a sentence. There is always an instance to point at, and there is always one right now.
An economic argument does not work that way. Most hours of most days, nothing has happened that changes what the Bank of Japan is likely to do in March. A teacher with a chart has a lesson available at all times. A teacher with a central bank has one when the central bank speaks.
7How Deep the Prerequisites Run
This course is its own evidence here.
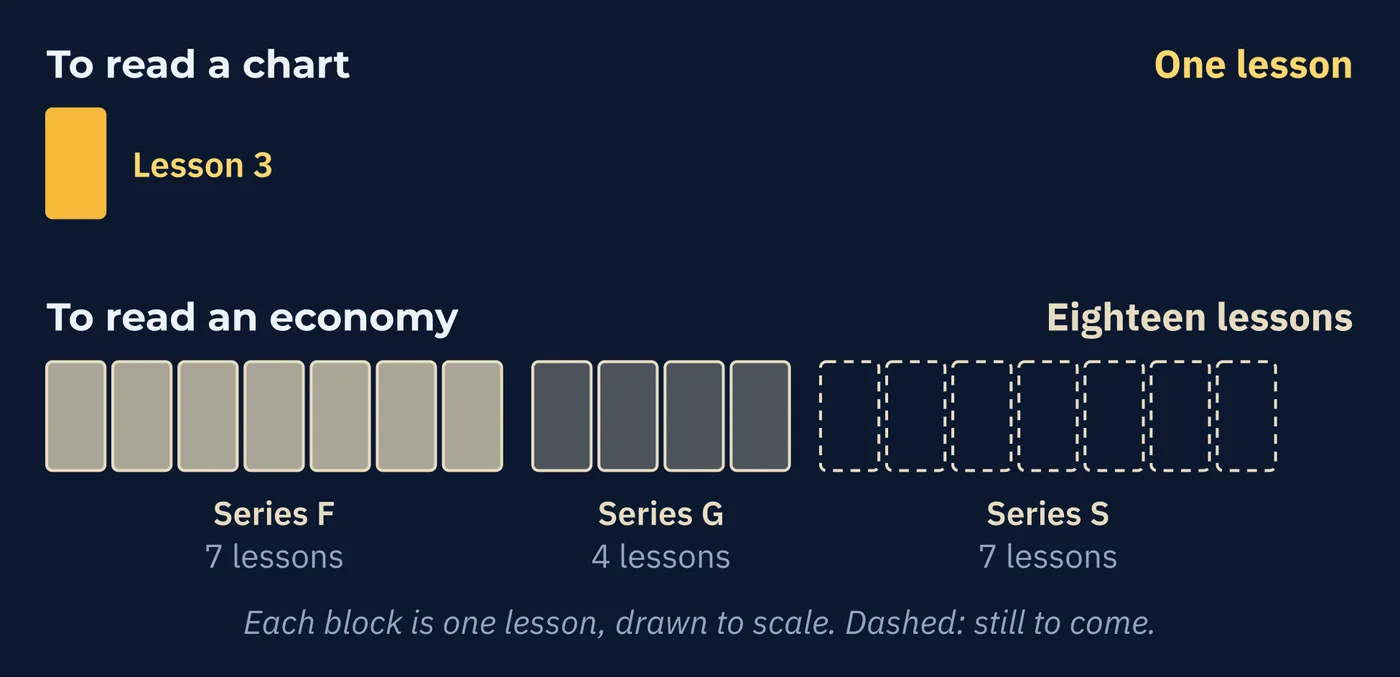
Reading a chart needed Lesson 3. Axes, timeframe, body, color, wicks. One lesson and a beginner can look at a chart and know what they are seeing.
Reading an economy needed considerably more. Series F spent seven lessons on what money is and where it comes from. Series G spent four more on the dollar's position. Series S, later in the course, will spend another seven turning that into something you can read a week with.
| To Start Reading | Prerequisites | Time to First Feedback | Data Cost |
|---|---|---|---|
| A chart | One lesson | Minutes to hours | Free |
| An economy | Many lessons | Weeks to months | Free, but scattered |
Neither row is better. The first row is simply reachable on a Tuesday evening, and the second is not, and education goes where people can follow.
8What This Does and Does Not Tell You
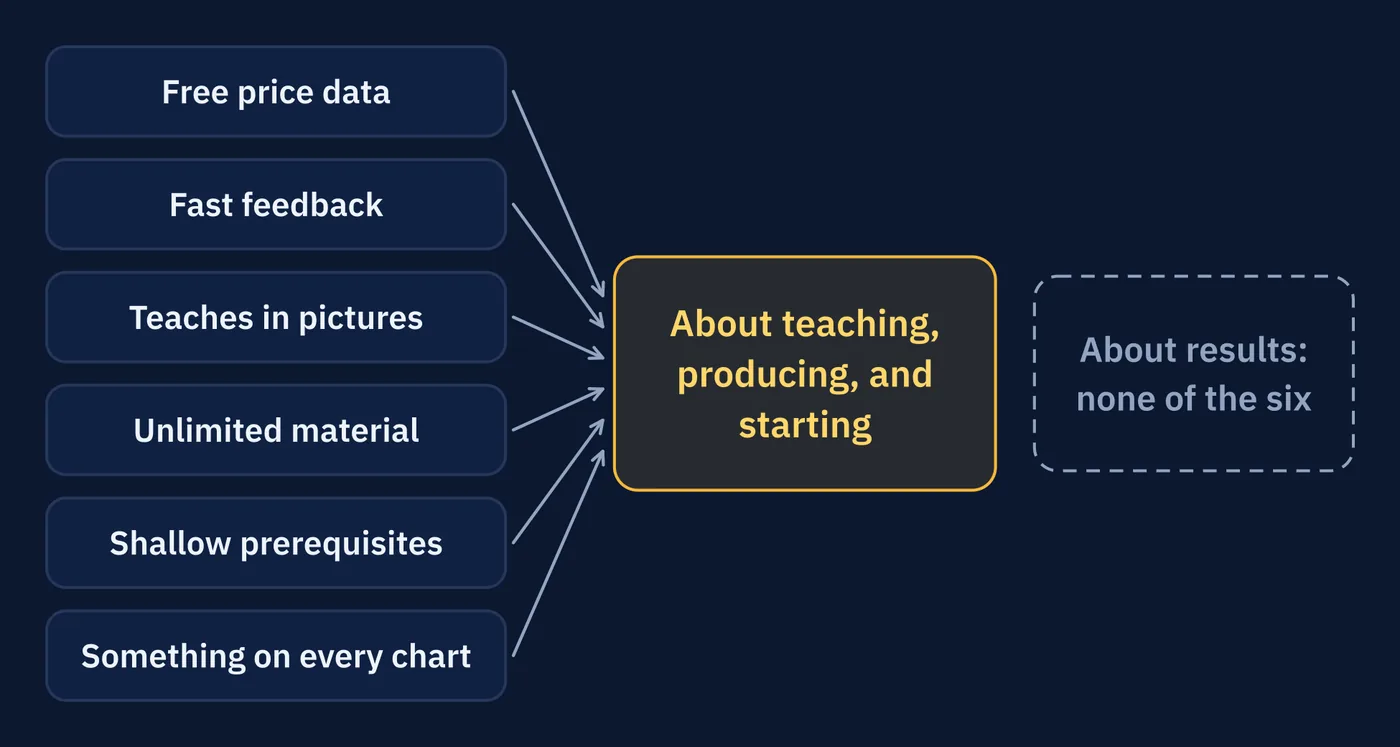
Collect the six reasons. Price data is free. Feedback is quick. The material shows well in pictures. There is always more of it. The prerequisites are shallow. And every chart has something on it worth discussing.
Every one of those is about teaching, producing, and starting. Not one of them is about results.
Popularity is evidence about the education market, not about the market.
So the dominance tells you nothing about whether technical analysis works. It is important to take that in both directions, because the opposite error is just as easy and is becoming fashionable.
What you should take from this lesson is narrower and more useful. The material you have encountered so far was selected by what teaches easily, not by what performs. Four approaches were quiet not because they were weighed and rejected, but because they are harder to start.
Lesson 54 weighs them.
Three Things to Remember
Try This
Forty minutes, and the clock is part of the exercise.
Words From This Lesson
| Term | What It Means |
|---|---|
| Economic calendar | A schedule of upcoming data releases and central bank decisions, listing what is published, when, and for which currency. |
| Consensus | What forecasters collectively expect a release to show, gathered before it lands. |
| Surprise | The gap between the released figure and the consensus. This, rather than the figure itself, is what moves a currency. |
| Revision | A later correction to a published figure. Revisions can be large enough to change what the original number appeared to mean. |
| Prerequisite | Something you must already understand before a new idea can make sense. Approaches differ widely in how deep their stack runs. |
Test Your Knowledge
Eight questions. Answer them all before checking the key on the following pages. If a question gives you trouble, the answer key tells you which section to revisit.
- A. Why technical analysis is the thing beginners are taught
- B. Whether technical analysis outperforms the alternatives
- C. Which indicators are most reliable
- D. Whether beginners should avoid fundamental analysis
- A. It is scattered across agencies, revised later, and meaningless without the expected figure
- B. It is published less often than prices
- C. It is expensive to obtain
- D. It only applies to a few currencies
- A. Fast feedback produces more reliable conclusions
- B. Slow feedback is only useful to professionals
- C. Regulators require quick demonstrations
- D. Fast outcomes fit inside a lesson and feel like progress
- A. There is none; more results always means better evidence
- B. A small number of quick outcomes is closer to noise than to evidence
- C. Reliable feedback is only available on higher timeframes
- D. Fast feedback is reliable as long as you record it
- A. New markets open every year
- B. Price data is continuously generated
- C. Settings, combinations and finer pattern definitions multiply without limit
- D. Older methods stop working and must be replaced
- A. Technical analysis should always be taught second
- B. Both approaches require roughly the same preparation
- C. Fundamental analysis cannot be taught to beginners
- D. Chart reading took one lesson; reading an economy took many
- A. Nothing; widespread adoption is meaningful evidence
- B. The premise is false, since most education is fundamental
- C. It reasons from how much is sold rather than from any evidence
- D. It ignores that beginners are usually unprofitable
- A. Those four were weighed by educators and found wanting
- B. They were quiet because they are harder to start, not because they were rejected
- C. They are intended for institutional participants only
- D. They have been superseded by technical methods
Answer Key
Each answer explains why the correct choice is correct, why the others are not, and where to reread.
Question 1 · correct answer A
The lesson separates two questions and answers only the second. Why beginners are taught this approach is a question about how education is made and paid for. Whether it outperforms is a question about markets, and Lesson 54 takes it.
B is the question the lesson explicitly declines. C is never addressed and belongs to Series M. D would be a recommendation, which this course does not make about any approach.
Review: Section 2, The Question Worth Asking
Question 2 · correct answer A
Each country publishes different series through different agencies on different schedules, figures are revised afterward, and a release only matters relative to what was expected, which must be sourced separately.
C is wrong because the data is generally free. B is wrong and irrelevant, since release frequency is not the obstacle. D is false; every major economy publishes extensively.
Review: Section 3, Price Is Free, and Nearly Universal
Question 3 · correct answer D
A chart idea resolves within the hour, so it fits inside a lesson and gives the learner a sense of progress. A months-long thesis cannot be demonstrated in a teaching format.
A confuses speed with reliability, which Section 4 separates explicitly. B invents a restriction. C is fabricated; no regulator requires this.
Review: Section 4, The Feedback Arrives Immediately
Question 4 · correct answer B
Twenty quick outcomes feel like evidence and are closer to noise. Series R puts a number on how many results are needed before a run of wins means anything, and it is larger than most people expect.
A is the error the section is written to prevent. C is wrong because timeframe does not determine reliability; sample size does. D is wrong because recording noise carefully still leaves it noise.
Review: Section 4, The Feedback Arrives Immediately
Question 5 · correct answer C
Every indicator has settings, every setting is a variant, combinations multiply, and patterns can always be defined more finely. Fundamental analysis by contrast has a finite syllabus, with new numbers each year but not new concepts.
A is irrelevant to the volume of teachable material. B is true but does not explain why the concepts multiply rather than the data. D is asserted without support and the lesson makes no such claim.
Review: Section 6, There Is Always Another One
Question 6 · correct answer D
Lesson 3 was enough to read a chart. Series F and G together took eleven lessons to build the background a fundamental reading requires, and Series S will add seven more.
B is contradicted by the course's own structure. C is wrong, since the course is in the middle of doing exactly that. A is a sequencing recommendation the lesson never makes.
Review: Section 7, How Deep the Prerequisites Run
Question 7 · correct answer C
The argument reads a verdict out of a sales volume. The six reasons for the dominance are all about teachability and production, so popularity is evidence about the education market rather than about results.
A is the error itself. B misstates what beginners actually encounter. D is a true fact about outcomes but is not what makes this particular argument invalid.
Review: Section 8, What This Does and Does Not Tell You
Question 8 · correct answer B
Nothing was weighed on the reader's behalf. The four were absent because they are slower to start, harder to show, and require more background, which is why Lesson 54 exists.
A assumes a judgment that was never made. C is false; all five approaches are available to retail traders. D asserts a supersession the lesson does not claim and no evidence supports.
Review: Section 8, What This Does and Does Not Tell You
Keep going
The Five Approaches is written by Kanin D. Alldredge for The Currency Classroom, and it is free to read. There is more free from CNS: start here.
Start free with CNS →