The Four Sessions

1Why It Never Closes
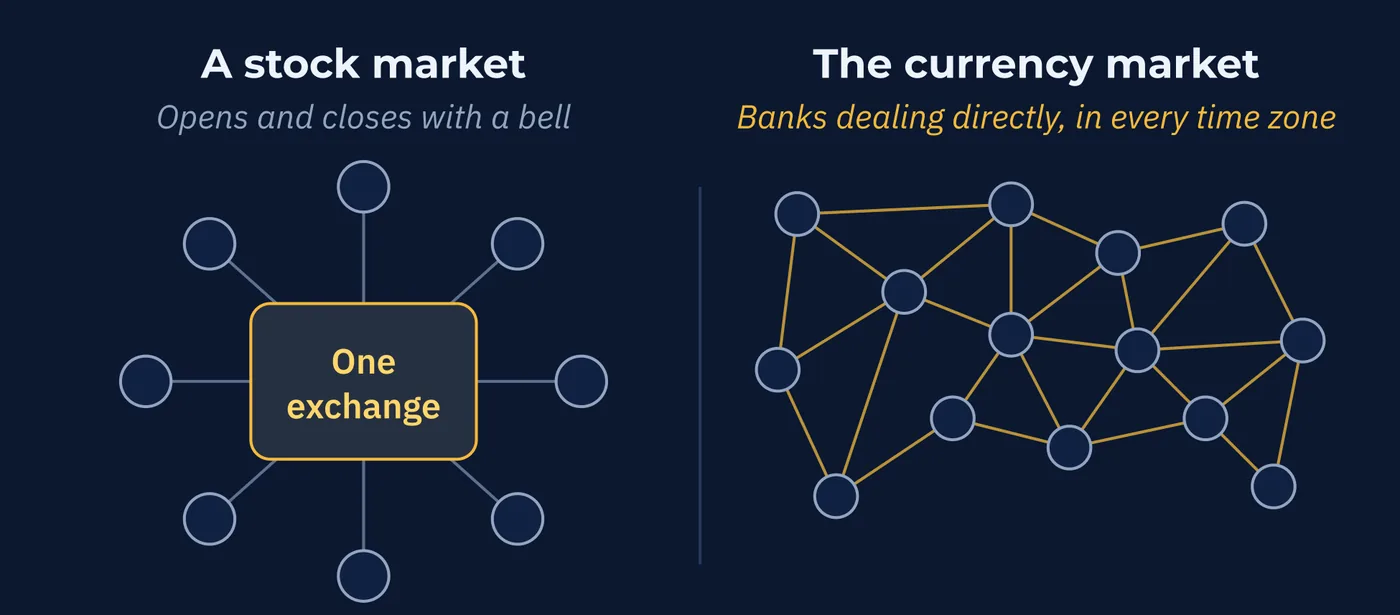
Stock markets have buildings. There is an exchange, it opens in the morning, it closes in the afternoon, and a bell marks each one.
Currencies have no such building. There is no central exchange anywhere in the world where currency trading happens. What exists instead is an enormous number of banks and institutions dealing directly with each other, in every time zone, continuously.
So there is nothing to open and nothing to close. The market is simply the sum of whoever is trading at that moment, and somebody is always trading.
That produces the twenty-four hour market described back in Lesson 6.
2Follow the Sun
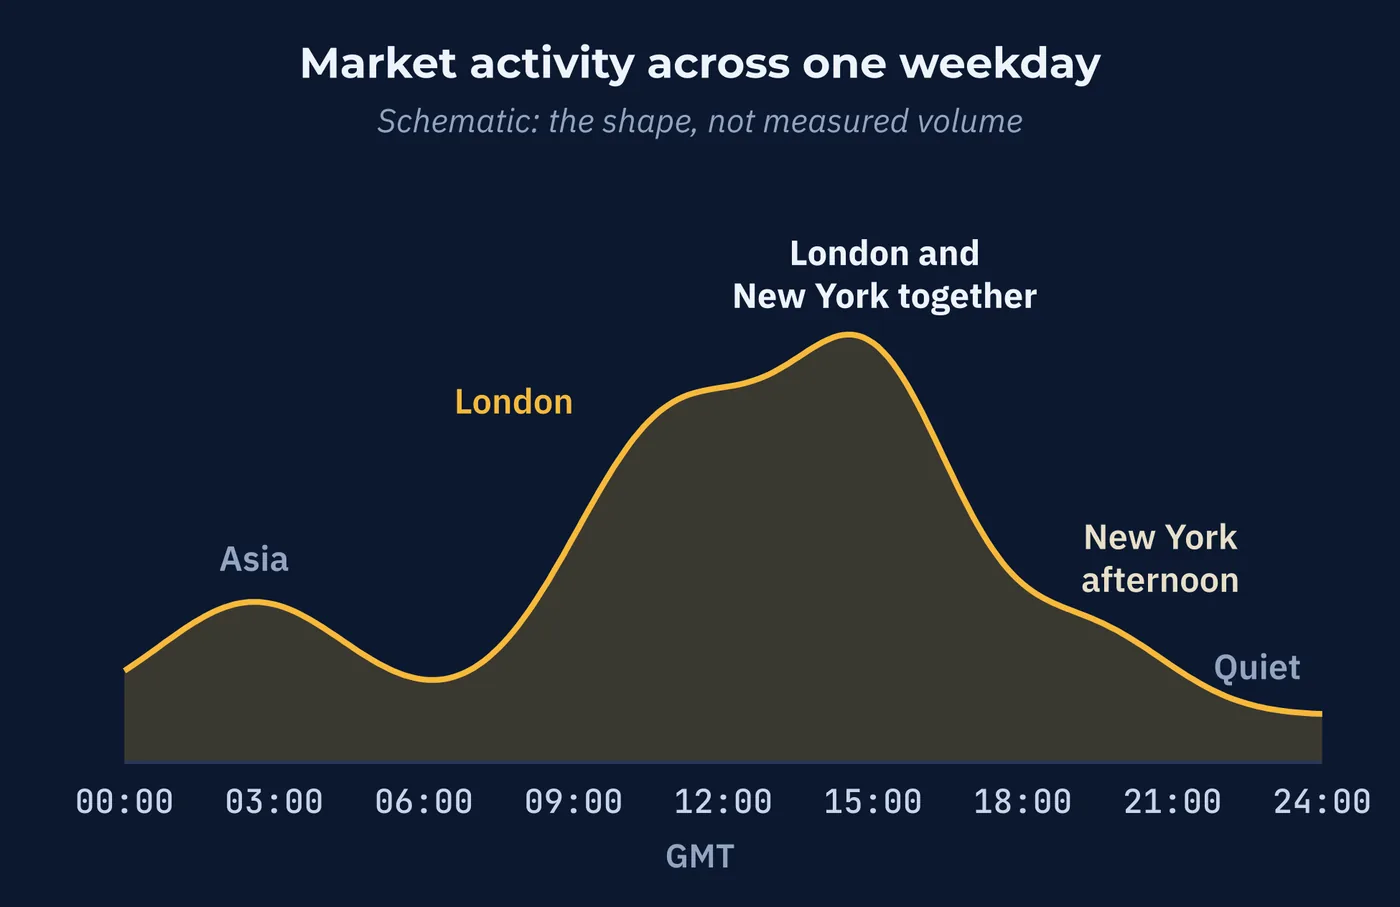
Activity does not spread evenly around the clock. It moves, and it moves with the working day.
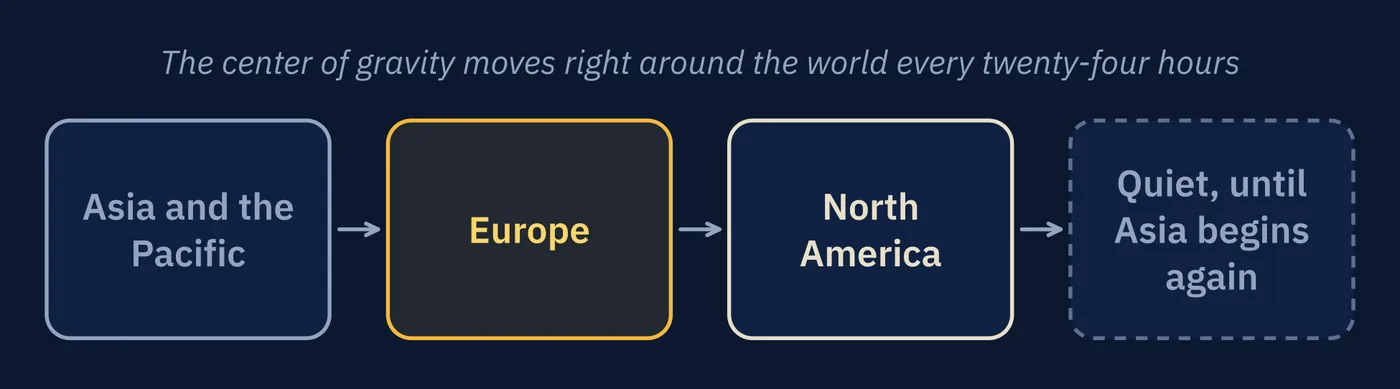
Trading picks up in Asia and the Pacific as those countries reach their business hours. As they wind down, Europe wakes and takes over. As Europe finishes, North America is already well into its day. Then things go quiet until Asia begins again.
Traders call this the follow-the-sun rotation, and the center of gravity moves right around the world every twenty-four hours.
Here is the consequence that matters, and it is the reason this lesson exists at all. Volume, liquidity and volatility are not properties of the market itself. They are properties of who happens to be awake.
When the participants change, the market's character changes with them.
3Open Is Not the Same as Active
This is the single most useful idea here, and it corrects an assumption almost every beginner makes.
The market being open does not mean your pair is worth trading.
At three in the morning in London, EUR/USD is absolutely available. You can open a position on it right now. But the people who actually move that pair, the European and American institutions, are asleep. What remains is a thin market with few participants.
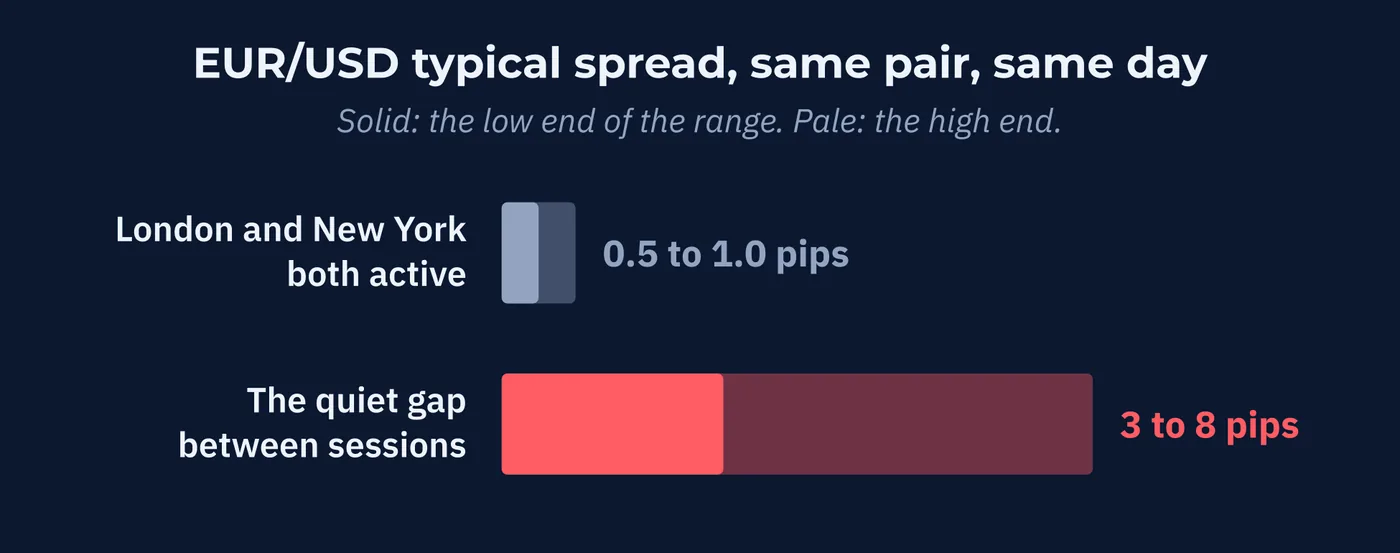
You already know what a thin market costs you, from Lesson 14. Spreads widen when fewer firms are quoting. On EUR/USD the difference is dramatic, running under a pip when the market is busiest and several pips in the quietest window.
| EUR/USD Conditions | Typical Spread |
|---|---|
| Busiest hours, London and New York both active | 0.5 to 1.0 pips |
| Quietest hours, the gap between sessions | 3 to 8 pips |
That is the same pair on the same day, costing up to eight times more to enter depending purely on the hour.
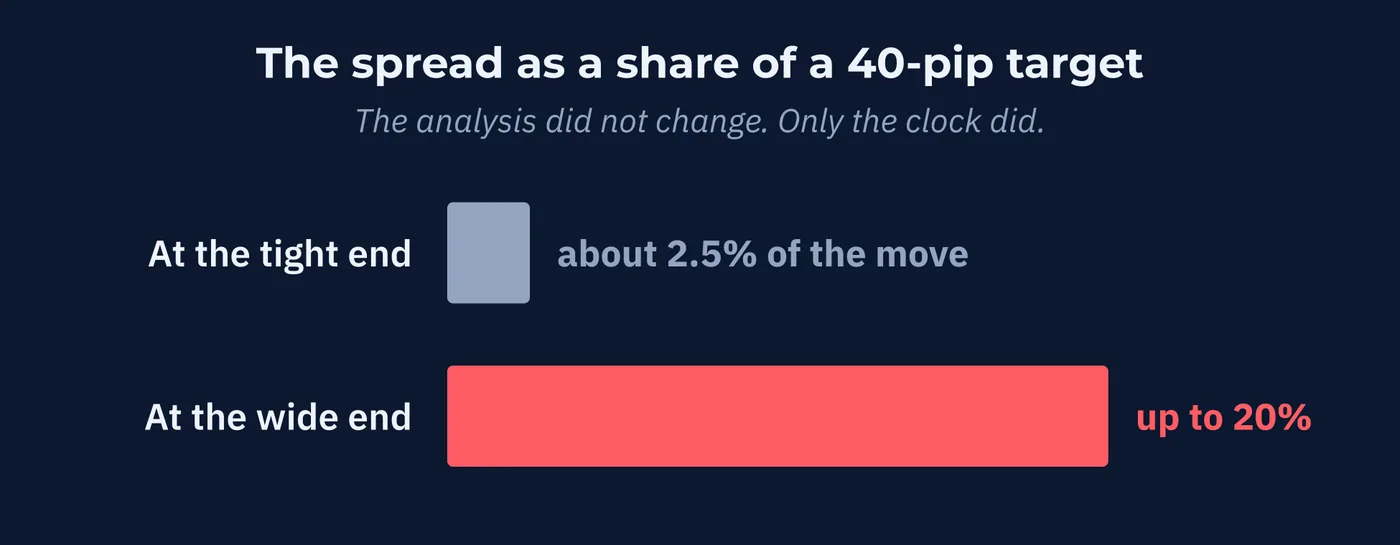
Apply Lesson 14's viability test to that. A trade targeting 40 pips costs about 2.5% of the move at the tight end and up to 20% at the wide end. The analysis did not change. Only the clock did.
4The Four Sessions
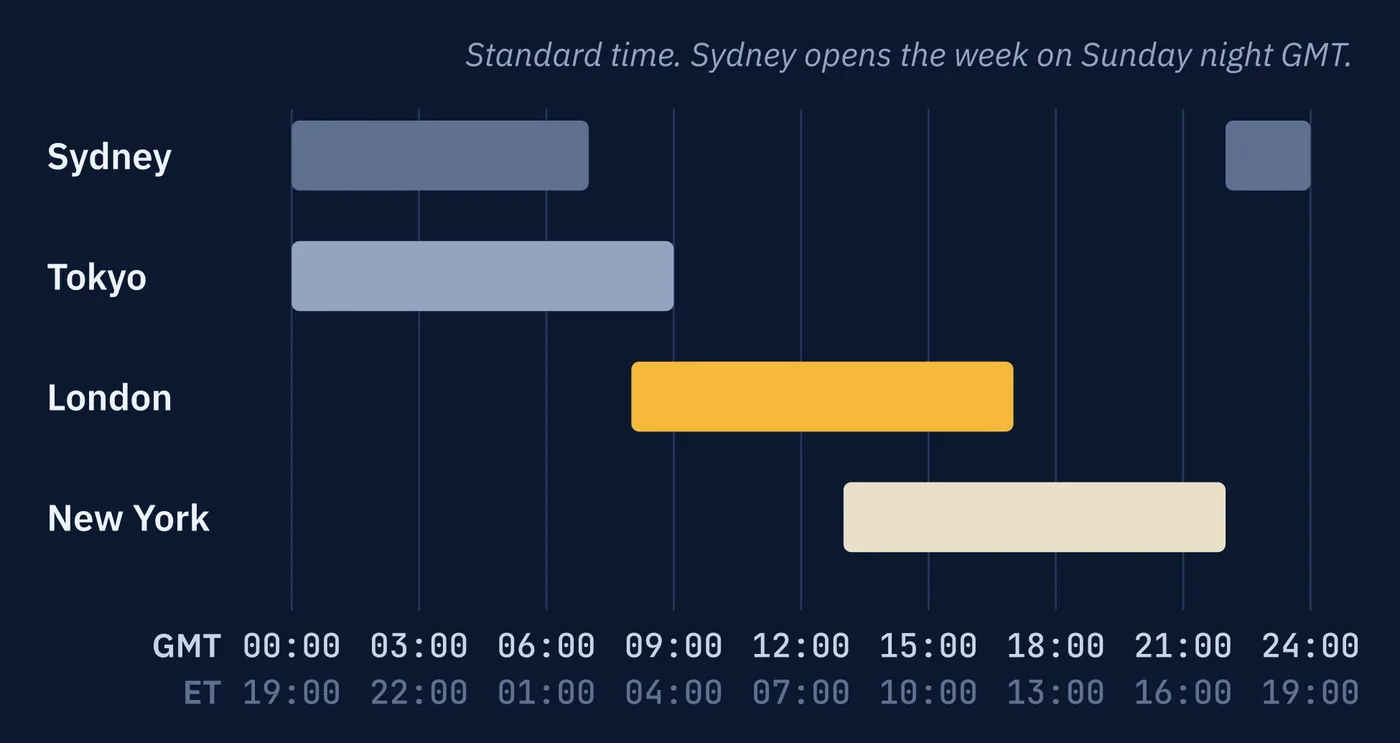
Activity is conventionally divided into four sessions, named for the cities that anchor them. They overlap, which is the subject of the next lesson.
| Session | GMT | Roughly ET | Known For |
|---|---|---|---|
| Sydney | 10pm to 7am | 5pm to 2am | Opens the week. Lowest volume. |
| Tokyo | 12am to 9am | 7pm to 4am | The Asian business day. Yen pairs. |
| London | 8am to 5pm | 3am to 12pm | The dominant session. Everything trades. |
| New York | 1pm to 10pm | 8am to 5pm | U.S. data. The largest single-day moves. |
Eastern times shown are for standard time. They shift when clocks change, which Section 7 covers.
Sydney
The smallest session by volume, and the one that opens the trading week after the weekend. The price it opens at becomes the reference point everything that follows is measured against.
Most relevant for AUD/USD and NZD/USD, which makes sense given whose business day it is.
Tokyo
The Asian institutional day, and the session where yen pairs are most active. USD/JPY does its most meaningful trading here.
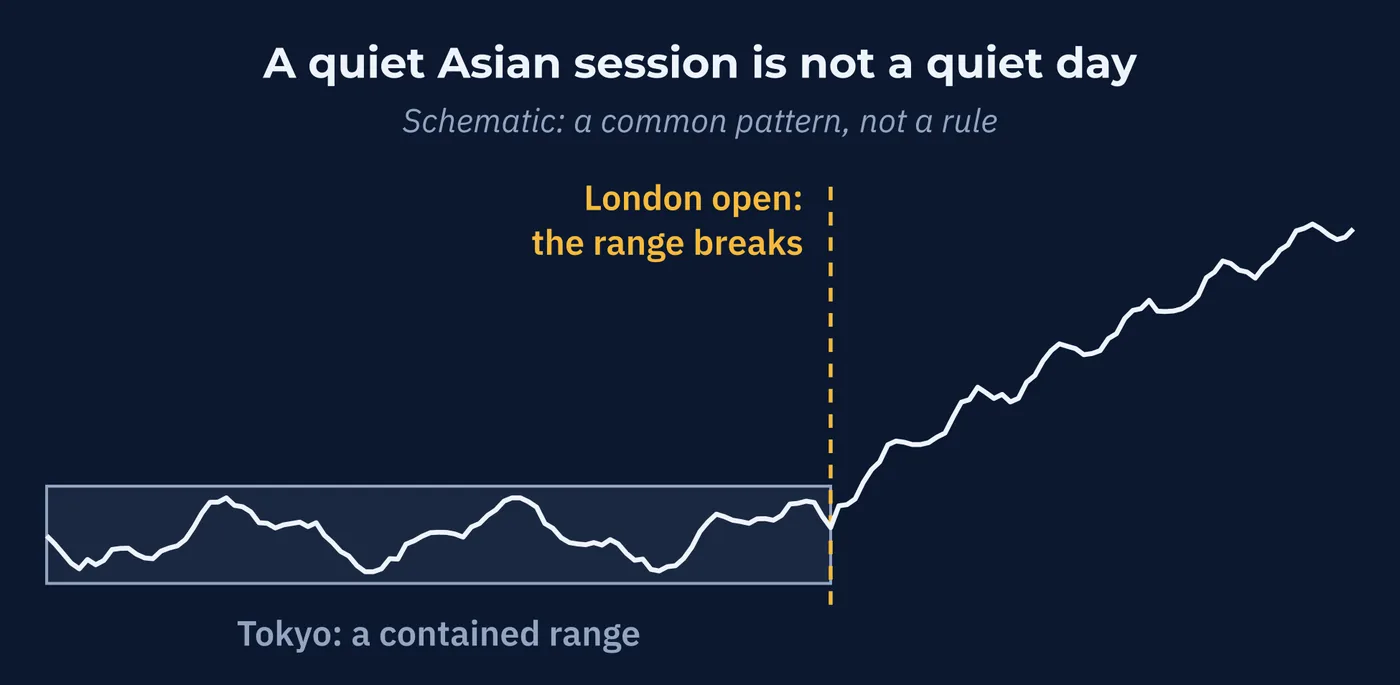
Tokyo often produces a fairly contained range rather than a strong direction. Prices settle into a band overnight, and that band frequently gets broken decisively when London arrives. Which is a useful thing to know before you conclude a quiet Asian session means a quiet day.
London The largest session in the world by a wide margin, and the most important few hours in the currency market.
Every major pair is active. Spreads are at their tightest. The London open is the most consistently significant recurring event in the trading day, and price frequently makes its decisive move of the day within its first hours.
If you can only watch the market during one window, this is the one with the most happening in it.
New York
Second largest, and the session where American economic data arrives. Recall from Lesson 5 that central bank announcements produce the biggest moves of any event. Most of the American ones land in this session.
It has one more feature worth knowing. When New York winds down on a Friday, the productive trading week is effectively finished. What follows is thin, and the weekend closure is next.
5Where the Trading Actually Happens
The sessions are named for cities, and it is fair to ask how much trading those cities really account for.
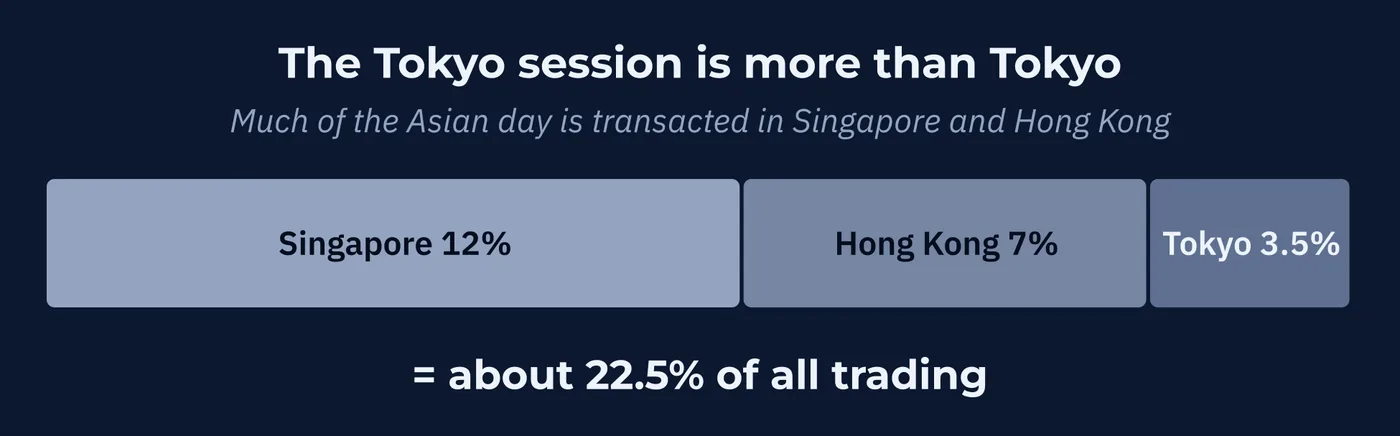
The Bank for International Settlements, whose survey produced the daily volume figure back in Lesson 1, also measures where that volume is transacted. Its 2025 survey found global daily turnover of about $9.6 trillion, split like this.
| Location | Share of Global Daily Volume |
|---|---|
| London | 38% |
| New York | 19% |
| Singapore | 12% |
| Hong Kong | 7% |
| Tokyo | 3.5% |
Two things stand out.
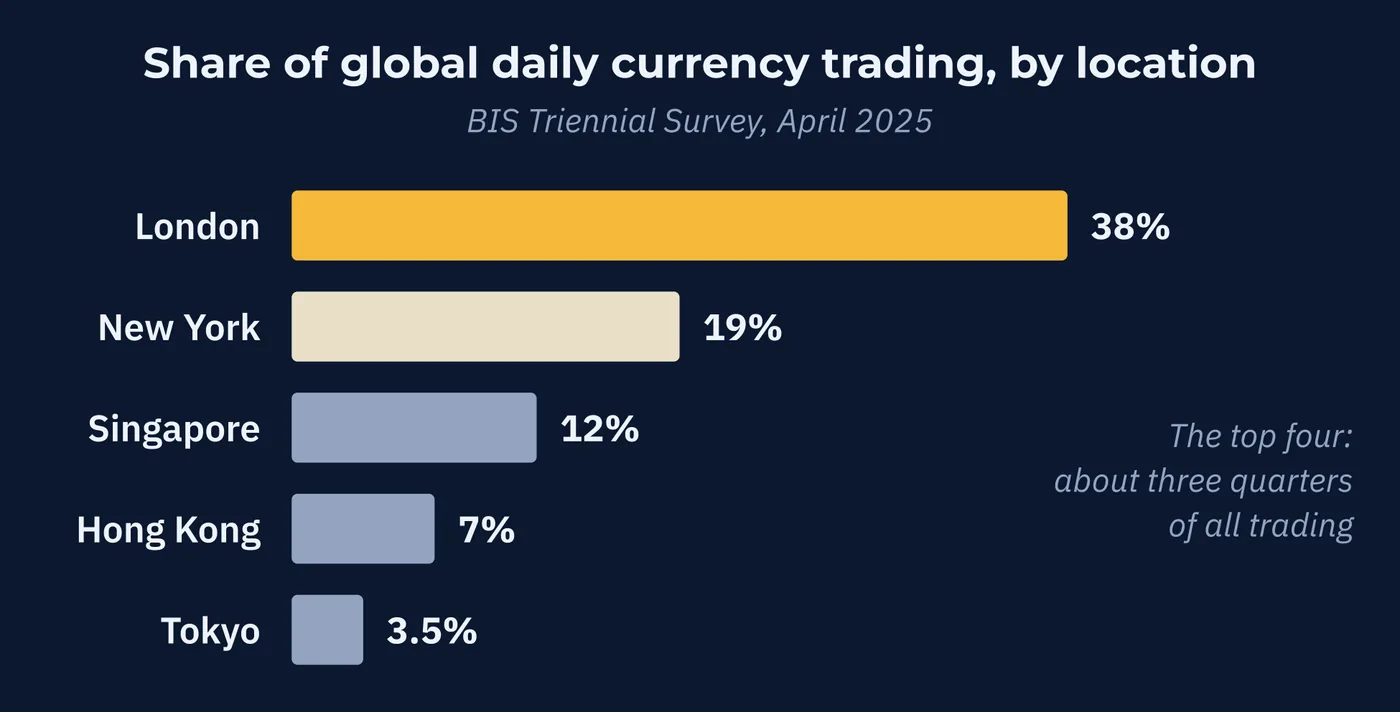
London alone handles roughly twice what New York does, and well over one and a half times the other three named centers combined. That concentration is why the London session dominates and why its open matters so much.
The other is that the top four locations account for roughly three quarters of all currency trading worldwide. An enormous global market turns out to be conducted, in practice, from a small number of places.
6Match the Pair to the Session
Put the sessions beside Lesson 8's point that every pair carries the character of its second currency, and a practical rule appears.
A pair is most active when the people who care about it most are at work.
| Pair | Most Active During | Because |
|---|---|---|
| EUR/USD, GBP/USD | London, and into New York | European institutions, then American ones |
| USD/JPY | Tokyo | The Japanese business day |
| AUD/USD, NZD/USD | Sydney and early Asia | Australian and New Zealand hours |
| USD/CAD | New York | Canadian and U.S. markets run together |
Which turns Lesson 12's instruction into something concrete. If the only hours you reliably have free fall in the Asian window, EUR/USD is a poor choice, not because it is a bad pair but because you would be trading it when it is quietest and most expensive.
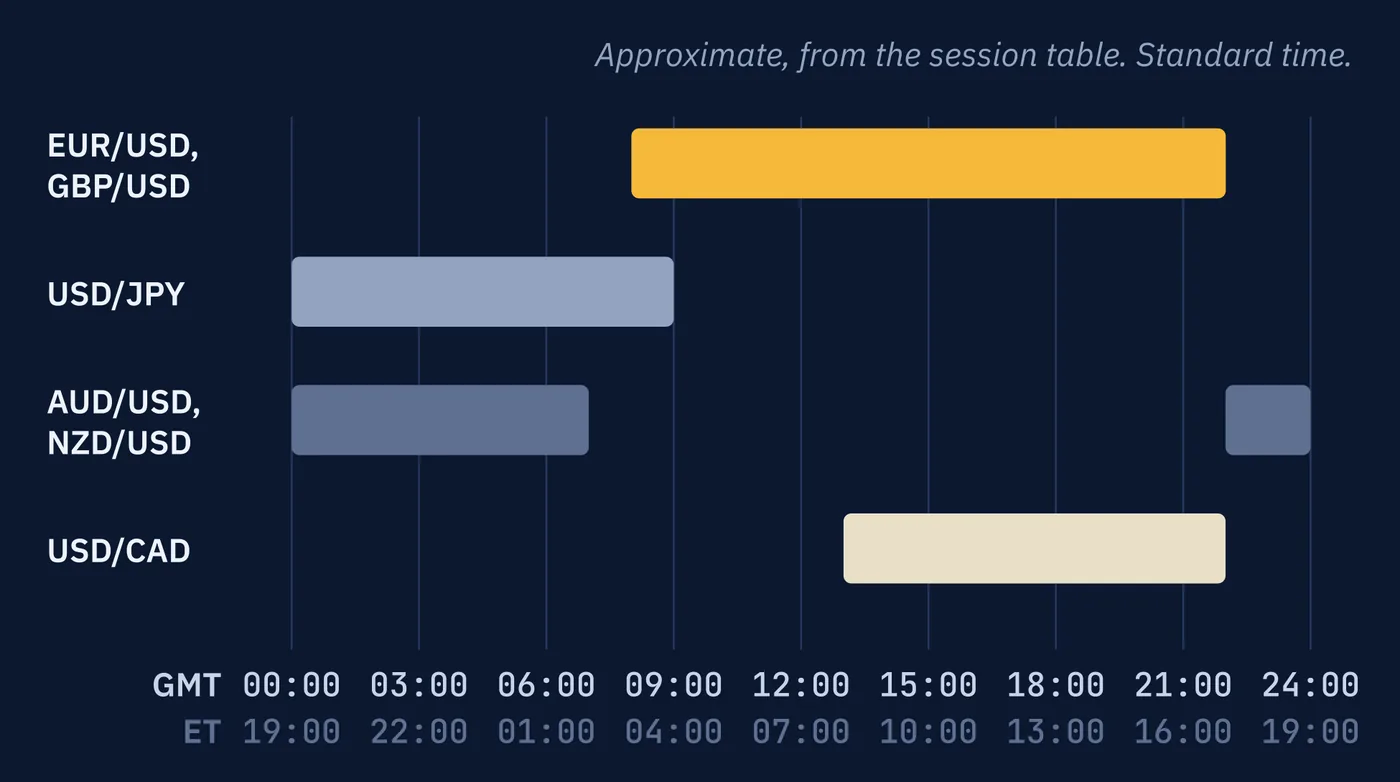
USD/JPY or AUD/USD would suit the same schedule far better. Same effort, same skill, better conditions.
7Your Map Breaks Twice a Year
One administrative detail that causes genuine confusion, so it is worth handling before it happens to you.
Session times are anchored to local business hours in each region. Those regions change their clocks for daylight saving, and they do not do it on the same dates. Some do not do it at all.
| Region | Daylight Saving |
|---|---|
| United States | Changes clocks, on its own dates |
| United Kingdom and Europe | Changes clocks, on different dates |
| Australia | Changes clocks in the opposite season, in Sydney and the southeast. Queensland, Western Australia and the Northern Territory do not. |
| Japan | Does not change clocks at all |
So for a few weeks each year, sessions sit an hour away from where your notes say they should be. Traders who have written down a session map and never revisit it end up trading the wrong window and wondering why conditions feel off.
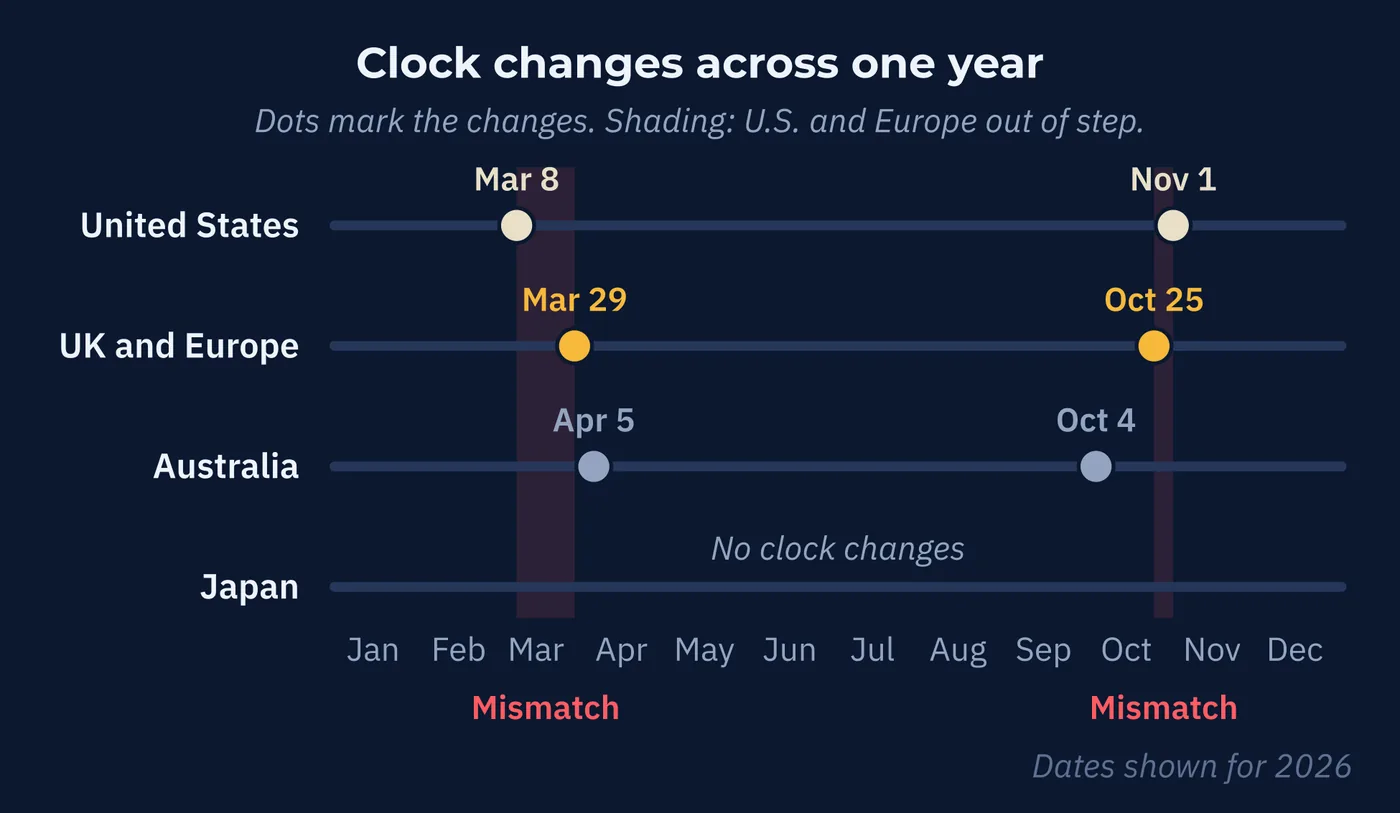
The fix is unglamorous. Put four reminders in your calendar for the transition dates, and check your session times against the clock at each one. It takes a minute and it prevents two confusing weeks.
Japan not changing at all is a small mercy. Tokyo session hours in GMT are stable year-round.
8What to Do With This
This lesson does not tell you when to trade. It tells you what you are trading into.
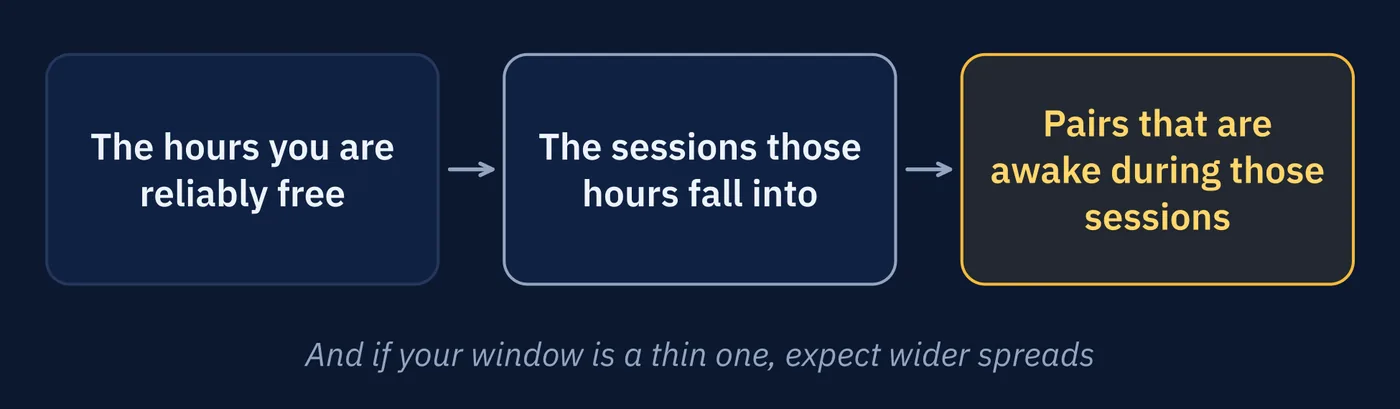
So the useful outcome is a simple one. Work out which sessions your available hours fall into. Then choose pairs that are awake during those hours, and expect wider spreads if your window is a thin one.
The next lesson looks at what happens where sessions overlap, which is where the best conditions of the entire week occur, and at the dead zone, which is where the worst do.
Three Things to Remember
Try This
Fifteen minutes. Build the session map that applies to your actual life.
Words From This Lesson
| Term | What It Means |
|---|---|
| Session | A block of hours named for the city whose business day anchors it. Sydney, Tokyo, London, and New York. |
| Follow-the-sun | The way trading activity moves around the world with the working day. |
| Liquidity | How many participants are actively buying and selling. High liquidity means tighter spreads. |
| Thin market | A period with few active participants, producing wider spreads and less reliable price movement. |
| London open | The start of the London session. The most consistently significant recurring event in the trading day. |
| GMT | Greenwich Mean Time, the reference zone session hours are usually quoted in. |
Test Your Knowledge
Eight questions. Answer them all before checking the key on the following pages. If a question gives you trouble, the answer key tells you which section to revisit.
- A. Regulators require continuous trading
- B. There is no central exchange, only institutions dealing across all time zones
- C. Computers trade automatically overnight
- D. It does close, but only briefly each day
- A. A trading strategy based on time of day
- B. The direction prices tend to move
- C. How activity moves around the world with the working day
- D. A schedule of central bank meetings
- A. Sydney
- B. London
- C. Tokyo
- D. New York
- A. 38%
- B. 19%
- C. 12%
- D. 75%
- A. They stay the same
- B. They become fixed
- C. They disappear entirely
- D. They can widen to several pips
- A. USD/JPY
- B. GBP/USD
- C. EUR/USD
- D. USD/CAD
- A. Brokers adjust their hours seasonally
- B. Exchanges extend hours in summer
- C. Trading volume follows the seasons
- D. Regions change clocks for daylight saving on different dates
- A. The United States
- B. The United Kingdom
- C. Japan
- D. Australia
Answer Key
Each answer explains why the correct choice is correct, why the others are not, and where to reread.
Question 1 · correct answer B
There is no building to open or close. The market is the sum of institutions dealing directly with each other, and in some time zone somebody is always working.
A invents a requirement that does not exist. C describes activity that happens but is not the reason the market is continuous. D is wrong for weekdays, though the market does close for the weekend.
Review: Section 1, Why It Never Closes
Question 2 · correct answer C
Activity picks up as each region reaches its business hours and fades as that region finishes, moving the center of activity around the world each day.
A confuses the structure with a strategy built on it. B is wrong because the rotation describes when activity happens, not which direction prices go. D describes scheduled events rather than the daily rhythm.
Review: Section 2, Follow the Sun
Question 3 · correct answer B
London handles about 38% of global daily volume, roughly twice New York's share and far more than any other center.
A is the smallest of the four. C is significant for yen pairs but small in global share. D is second largest, which makes it the most tempting wrong answer here.
Review: Section 5, Where the Trading Actually Happens
Question 4 · correct answer A
The 2025 BIS survey put London at about 38%, the largest single share by a wide margin.
C is roughly Singapore's share. B is roughly New York's. D is closer to the combined share of the top four locations rather than London alone.
Review: Section 5, Where the Trading Actually Happens
Question 5 · correct answer D
Fewer firms are quoting, so the spread widens. On EUR/USD it can reach several pips, which is many times the cost of the same trade during busy hours.
A ignores that spreads respond to how many participants are active. C is wrong because a spread always exists. B describes a fixed-spread account rather than what happens in thin conditions.
Review: Section 3, Open Is Not the Same as Active
Question 6 · correct answer A
USD/JPY is most active during the Tokyo session, so Asian hours line up with the pair's own busiest window.
C and B are London pairs and would be at their thinnest during Asian hours. D is most active during North American hours.
Review: Section 6, Match the Pair to the Session
Question 7 · correct answer D
Sessions are anchored to local business hours, and regions change their clocks on different dates. For a few weeks each year the windows sit an hour from where a fixed map says.
A is wrong because brokers do not set session activity. C confuses clock changes with seasonal volume patterns. B describes a practice from exchange-based markets that does not apply here.
Review: Section 7, Your Map Breaks Twice a Year
Question 8 · correct answer C
Japan does not observe daylight saving, so Tokyo session hours in GMT stay the same throughout the year.
A, B, and D all change their clocks, and they do so on different dates from each other, which is precisely what makes a fixed session map unreliable.
Review: Section 7, Your Map Breaks Twice a Year
Keep going
Building Your Trading Life is written by Kanin D. Alldredge for The Currency Classroom, and it is free to read. There is more free from CNS: start here.
Start free with CNS →