Margin and the Stop-Out

1Margin Is Collateral, Not Cost
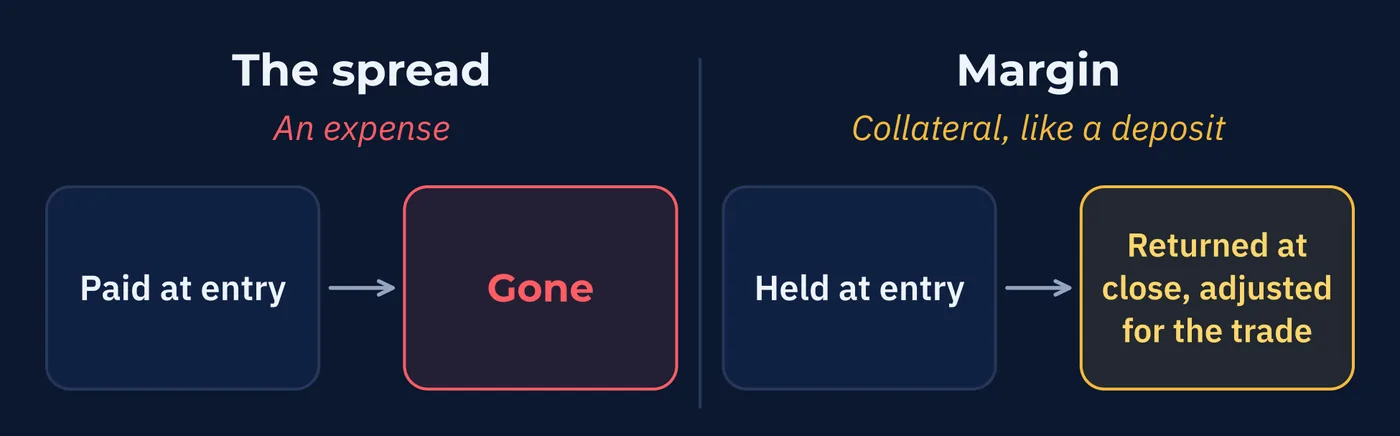
When you open a leveraged position, your broker holds some of your money. That money is called margin, and the first thing to be clear about is what it is not.
It is not a fee. It is not spent. Nobody keeps it.
Margin is collateral. The broker holds it while the position is open and gives it back when the position closes, adjusted for whatever the trade did. Think of it as a deposit rather than a charge.
This is worth getting straight because the word sounds like an expense, and it is not. The spread was an expense. Margin is your own money, set aside and waiting.
2How Much Gets Held
The amount follows directly from the leverage ratio.
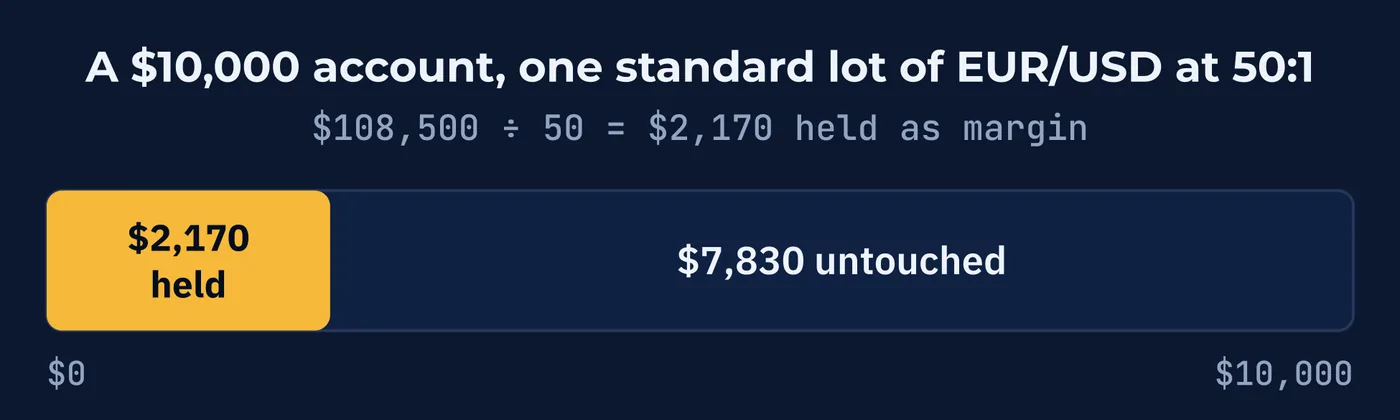
position value ÷ leverage ratio = required marginOne standard lot of EUR/USD at 1.0850 is a position worth $108,500. At 50:1:
$108,500 ÷ 50 = $2,170 heldSo a trader with a $10,000 account can open that position and still have $7,830 untouched.
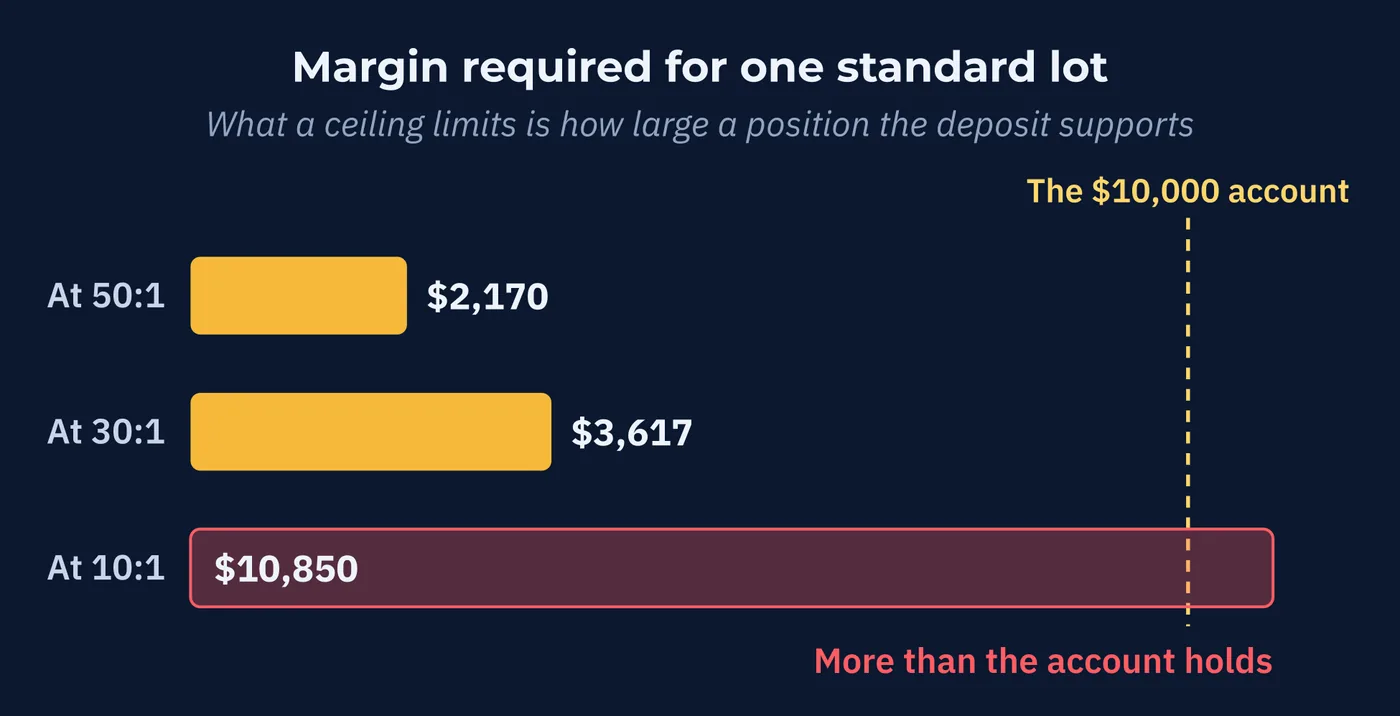
Lower leverage means more is held. The same position at 30:1 requires about $3,617, and at 10:1 $10,850, which is more than the account has. That is what a leverage ceiling actually restricts: not what you may believe, but how large a position your deposit can support.
3The Five Numbers
Every leveraged account shows five figures. They confuse people because two of them look like they should be the same and are not.
| Figure | What It Is |
|---|---|
| Balance | The cash in your account, ignoring open positions. |
| Equity | Balance adjusted for the live profit or loss on open positions. This is the real number. |
| Used margin | The collateral currently held against your open positions. Fixed when the position opens. |
| Free margin | Equity minus used margin. What is left to absorb further movement. |
| Margin level | Equity divided by used margin, as a percentage. The one the broker watches. |
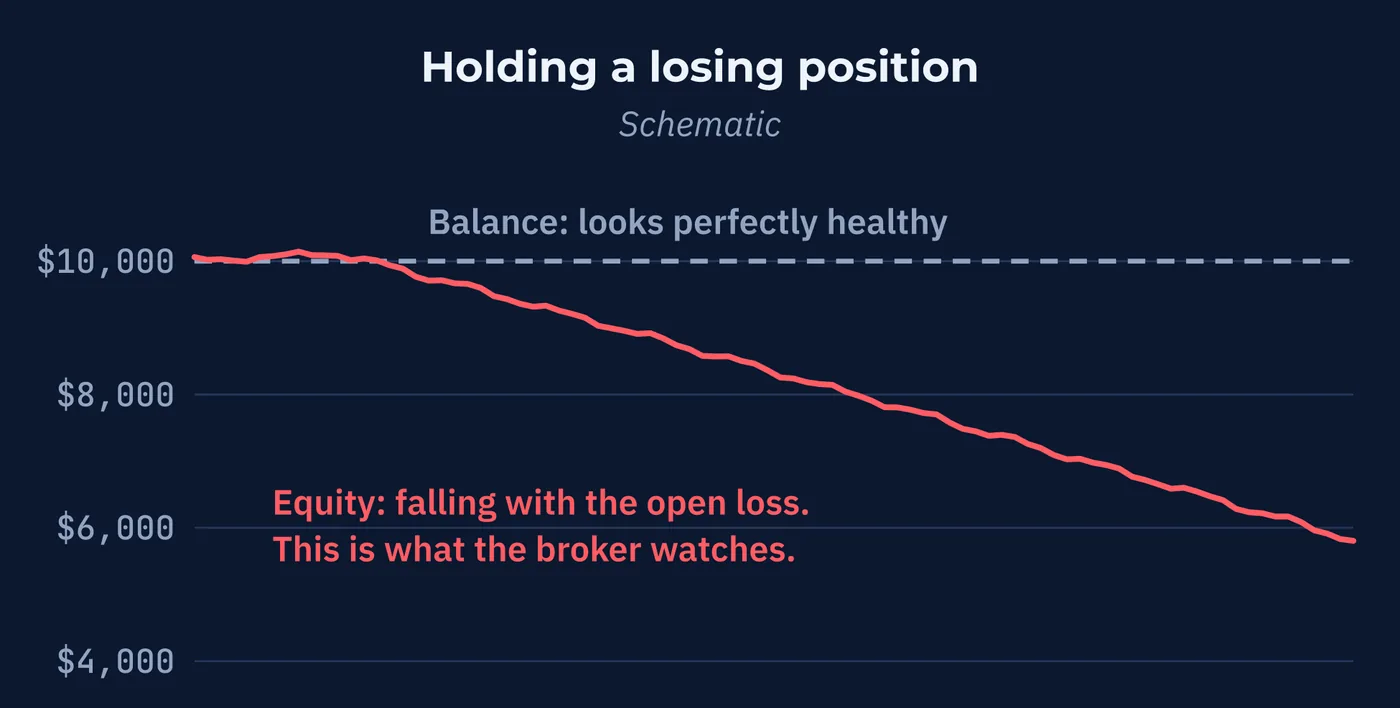
The distinction that matters is balance against equity.
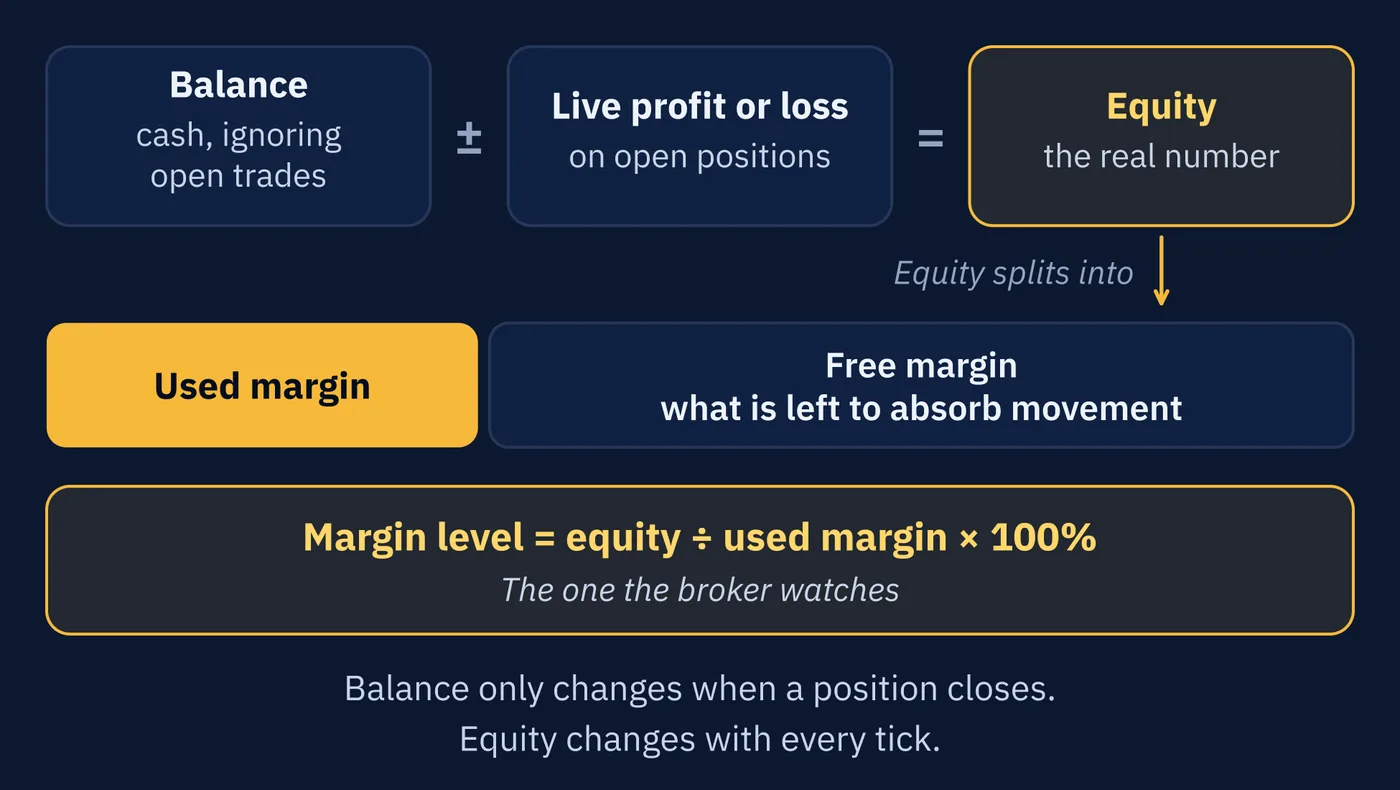
Balance only changes when a position closes. Equity changes with every tick. If you are holding a losing position, your balance can look perfectly healthy while your equity is falling toward a threshold.
Your broker is not watching your balance. It is watching your equity.
4Two Thresholds
The margin level is the figure that decides everything. It is equity divided by used margin, written as a percentage.
Take our trader. Equity of $10,000, used margin of $2,170.
$10,000 ÷ $2,170 × 100 = 461%That is a reasonable margin level. As a general rule of thumb, 500% or higher provides a comfortable margin buffer, although there is no single percentage that guarantees safety.
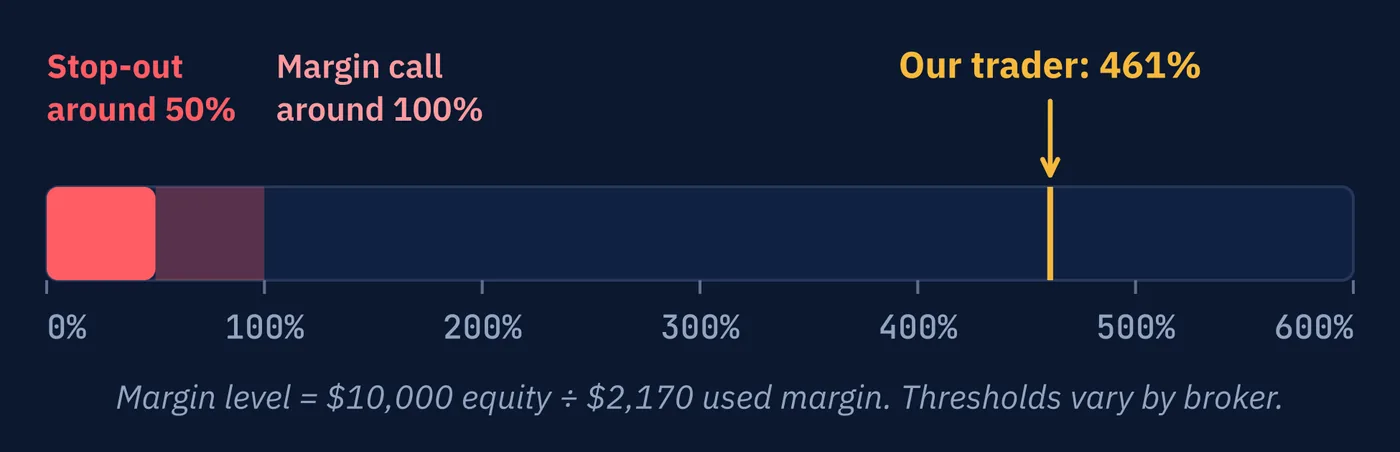
As the position loses, equity falls and the margin level falls with it. Two thresholds then come into play at most brokers.
| Margin Level | What Happens |
|---|---|
| Around 100% | Margin call warning. You cannot open new positions. |
| Around 50% | Stop-out. The broker closes positions automatically. |
That second one is the stop-out, and it is worth being precise about what it means. Your position is closed for you. Not suggested, not warned about again. Closed, by an automated system, at whatever price is available.
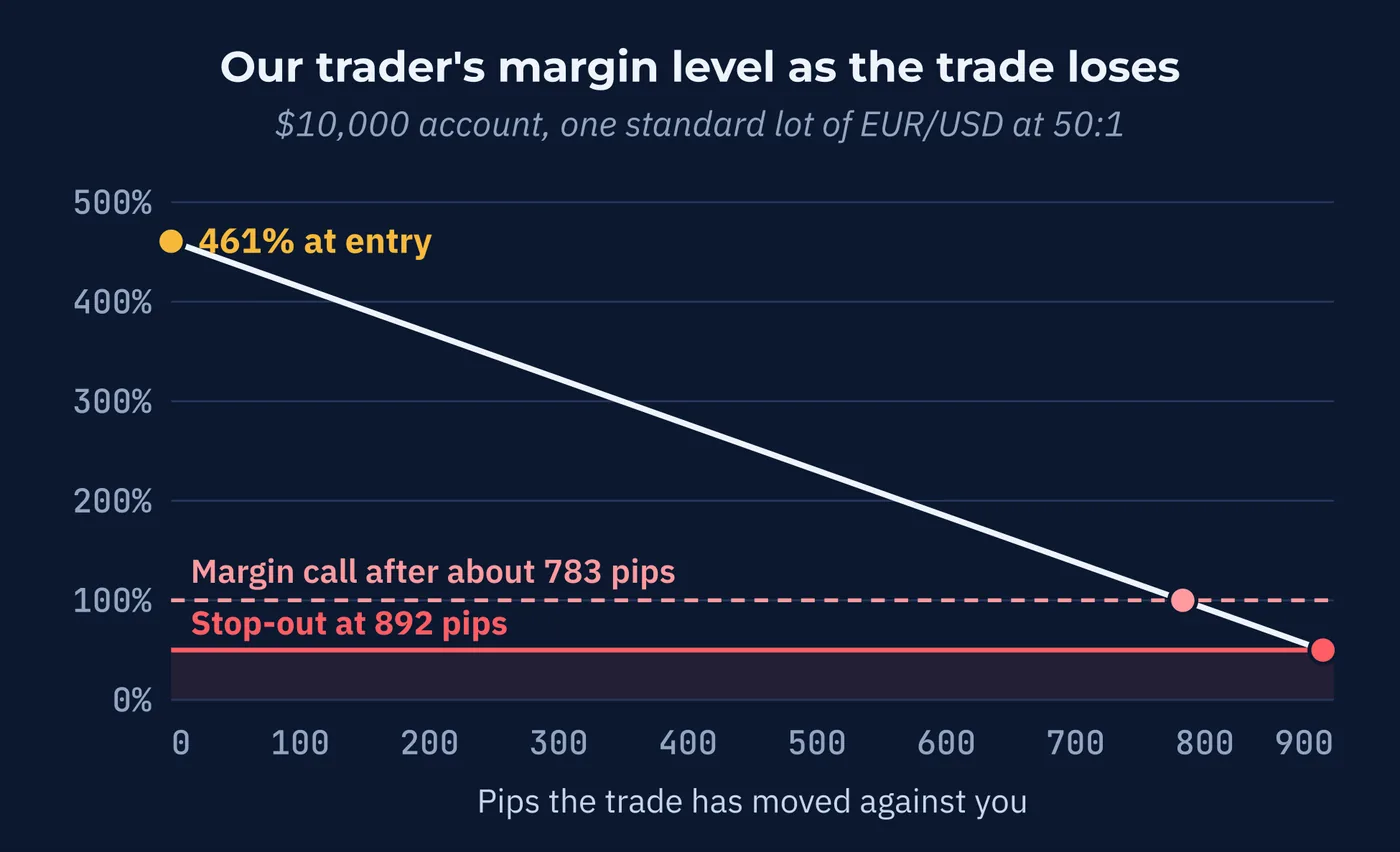
These levels are set by the broker rather than by law, and they vary. Yours are in the trading conditions document, and they are worth looking up before they matter rather than afterward.
5How Far Can It Move Against You?
This is the most useful calculation in the lesson, and almost nobody runs it.
You can work out, before entering, exactly how many pips the market can travel against you before the stop-out fires. Two steps.
First, the level equity must fall to. At a 50% stop-out, that is half the required margin.
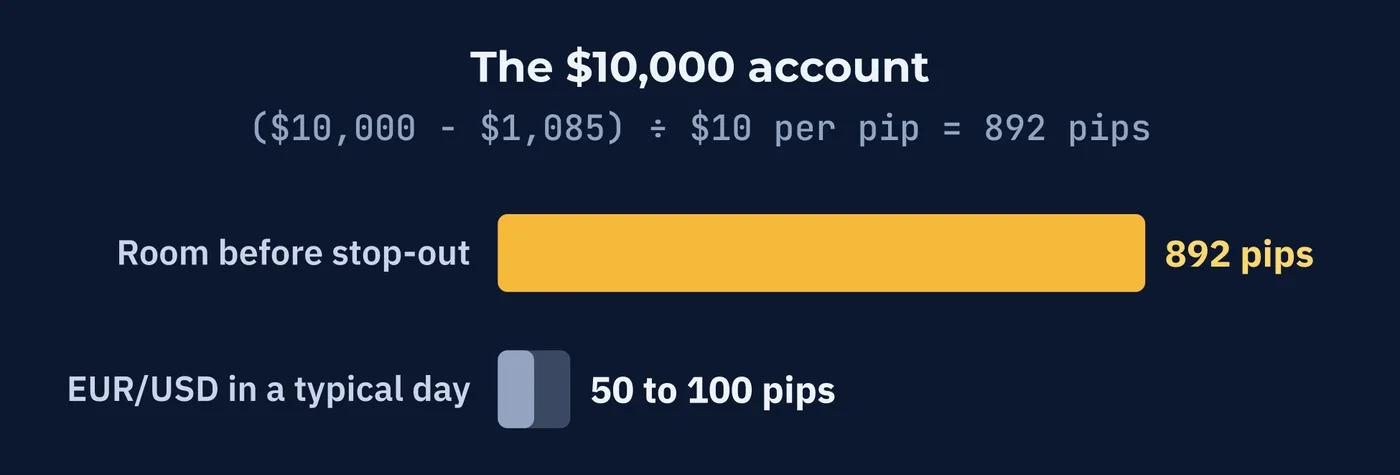
$2,170 × 0.50 = $1,085Then take the distance from where you started, and divide by what a pip costs you.
( $10,000 − $1,085 ) ÷ $10 = 892 pipsNearly nine hundred pips of room. On EUR/USD, which typically covers 50 to 100 pips in a day, that is a lot of breathing space.
Now change one thing. Not the leverage, not the pair, not the position size. Just the account.
| Account | Margin Level at Entry | Room Before Stop-Out |
|---|---|---|
| $10,000 | 461% | 892 pips |
| $3,000 | 138% | 192 pips |
| $2,500 | 115% | 142 pips |
Same trade in every row. The $2,500 account has 142 pips of room on a pair that routinely moves 50 to 100 pips in a single day.
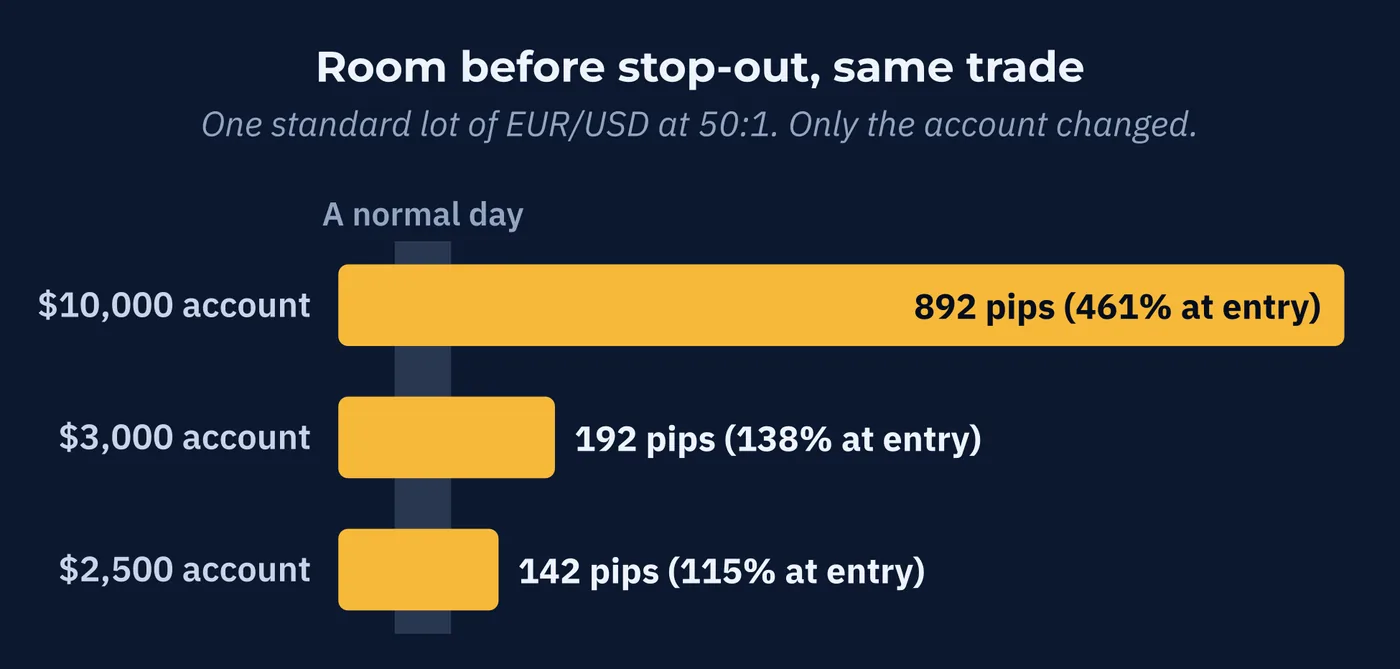
That account cannot survive an ordinary week. Not an unusual week, not a crisis. A normal one.
Account size decides how much room a position has, not the leverage ratio.
Both traders used the same broker at the same 50:1 ceiling. One had a position sized sensibly for the account. The other did not, and the arithmetic was visible before either of them clicked.
6The Stop Loss Takes the Decision Back
A stop loss is an instruction to your broker: if the price reaches this level, close the position. You set it, usually when the trade opens.
It changes what kind of exposure you are holding. Without one, a losing position stays open until you intervene or the stop-out does it for you. With one, the maximum loss is decided in advance, by you, before anything has gone wrong.
Watch the difference on our $10,000 account.
| With a 100 Pip Stop Loss | With No Stop Loss | |
|---|---|---|
| Position closes at | 100 pips against you | About 892 pips against you |
| Loss | $1,000 | $8,915 |
| Account remaining | $9,000 | About $1,085 |
| Who decided | You, before the trade | The broker's system |
Both traders were equally wrong about direction. One lost a tenth of the account and can trade tomorrow. The other lost nearly all of it.
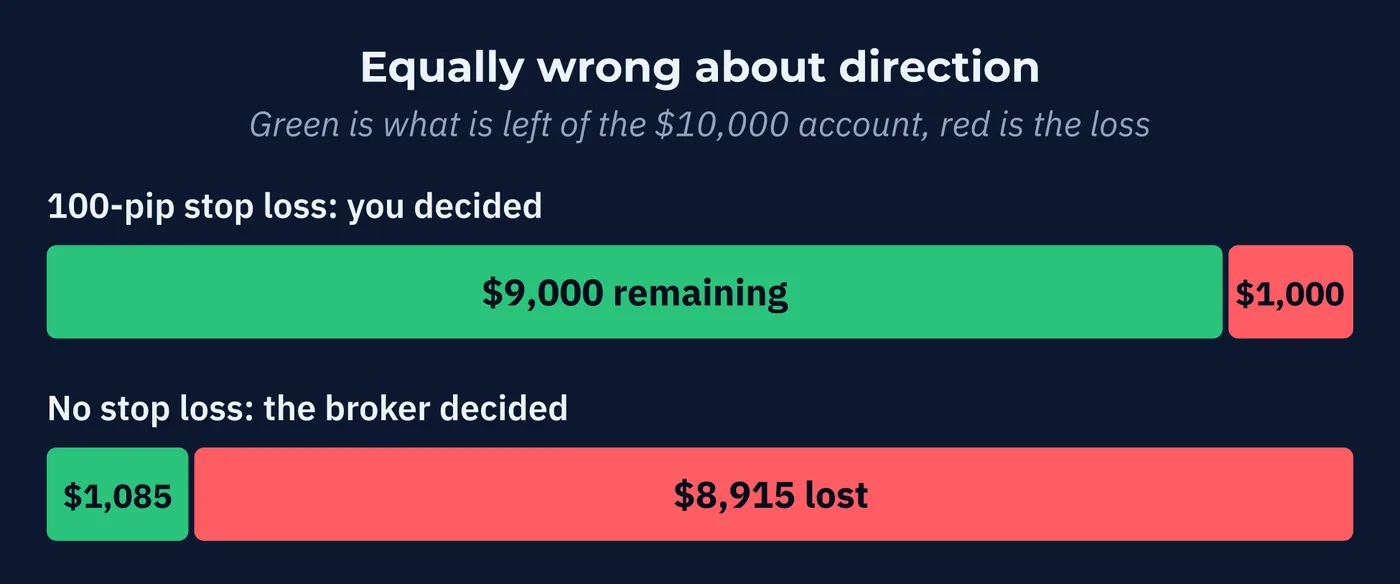
Two limits are worth knowing. A stop loss does not guarantee the exact price in a fast or gapping market, which is the risk Lesson 10 raised on exotic pairs. And it defines your loss in pips rather than in money. Turning that into a dollar figure needs position size, which is why the two decisions belong together.
7Three Positions, One Bet
One more effect, and it catches people who believe they are being careful.
Every open position consumes used margin. Open a second and a third, and the margin level falls before the market has moved at all.
Our $10,000 account opens three standard lots: EUR/USD, GBP/USD, and AUD/USD.
| Position | Required Margin |
|---|---|
| EUR/USD | $2,170 |
| GBP/USD | $2,540 |
| AUD/USD | $1,300 |
| Total used margin | $6,010 |
The margin level at entry is now 166%, down from 461% with a single position. Nothing has happened yet.
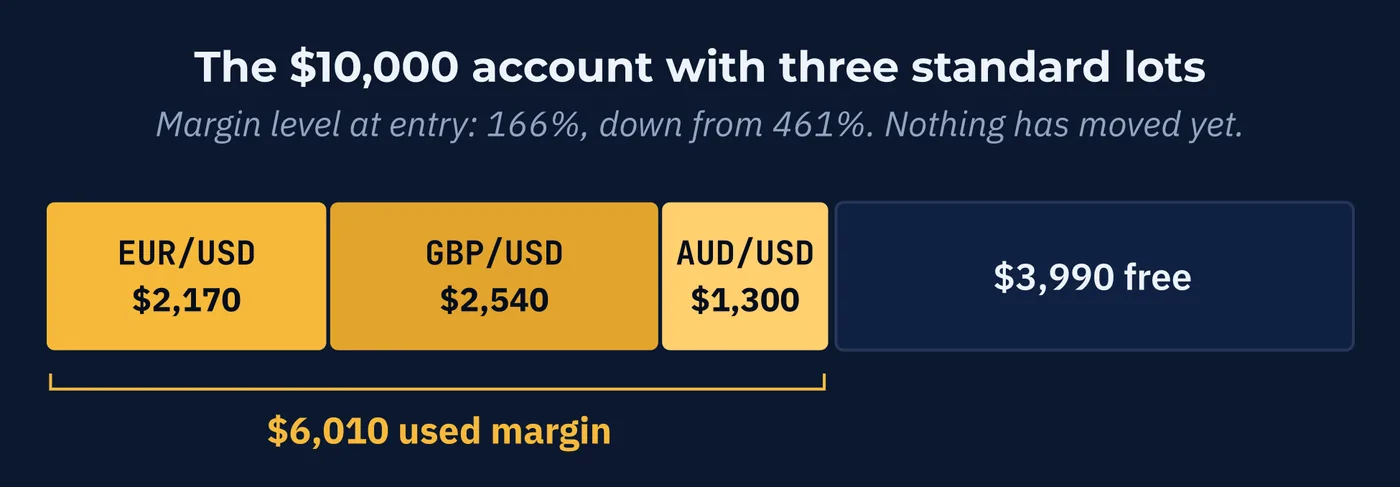
Now recall Lesson 7. All three of those pairs have the dollar as the quote currency, so all three fall when the dollar strengthens. This is not three positions. It is one bet against the dollar, placed three times.
The dollar rises 150 pips, which is a single active session.
150 pips × $10 × 3 positions = $4,500 lostEquity falls to $5,500 and the margin level drops to 92%. The margin call has fired. No new positions can be opened, and the account is one more ordinary move from a stop-out.
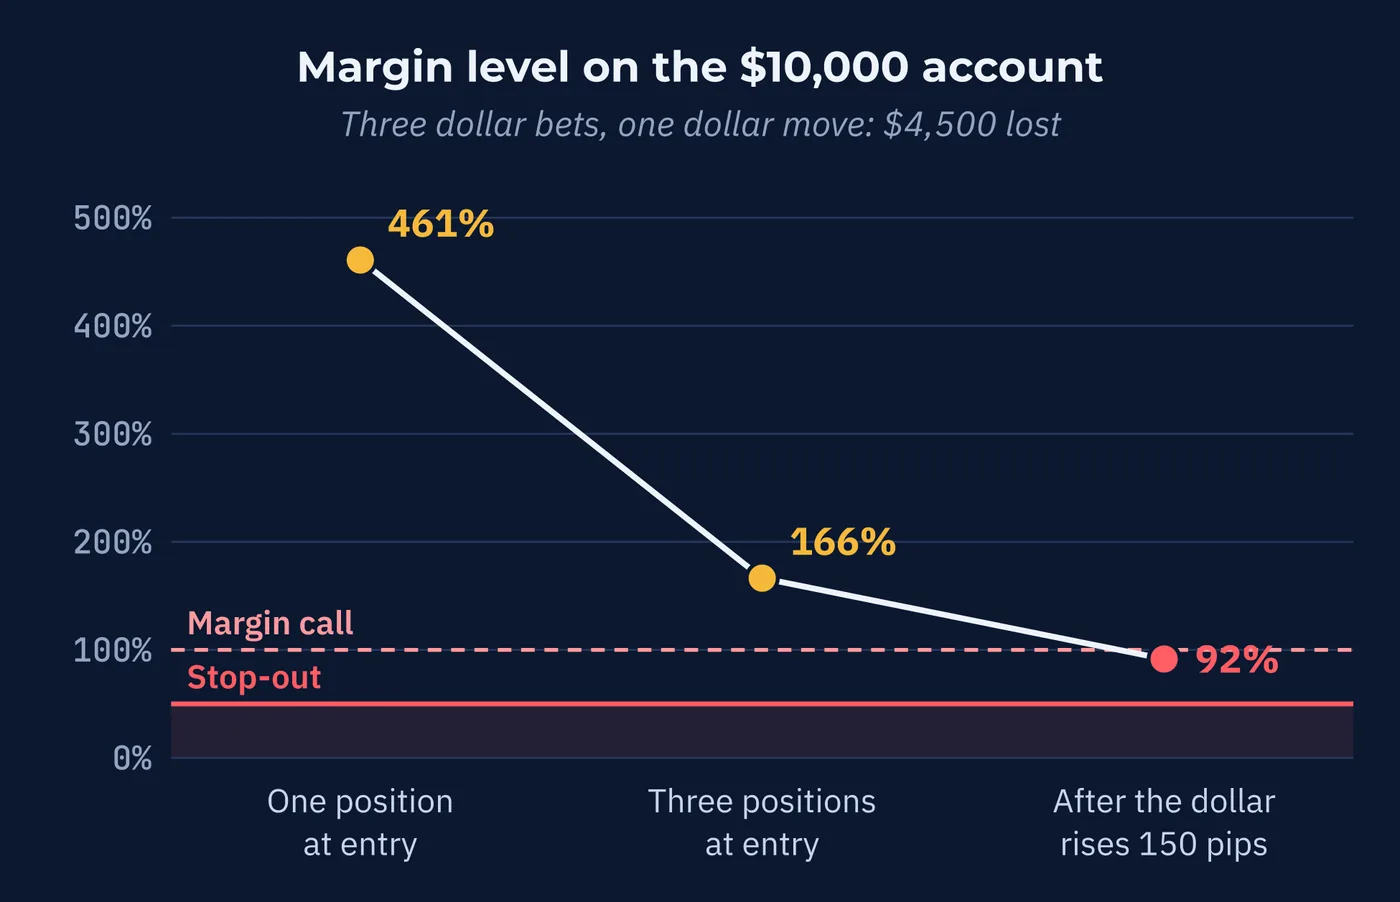
Correlated positions do not spread risk. They multiply the consumption of margin and the speed of the decline, at the same time.
8When the Stop-Out Does Not Save You
One last thing, because it explains why negative balance protection exists.
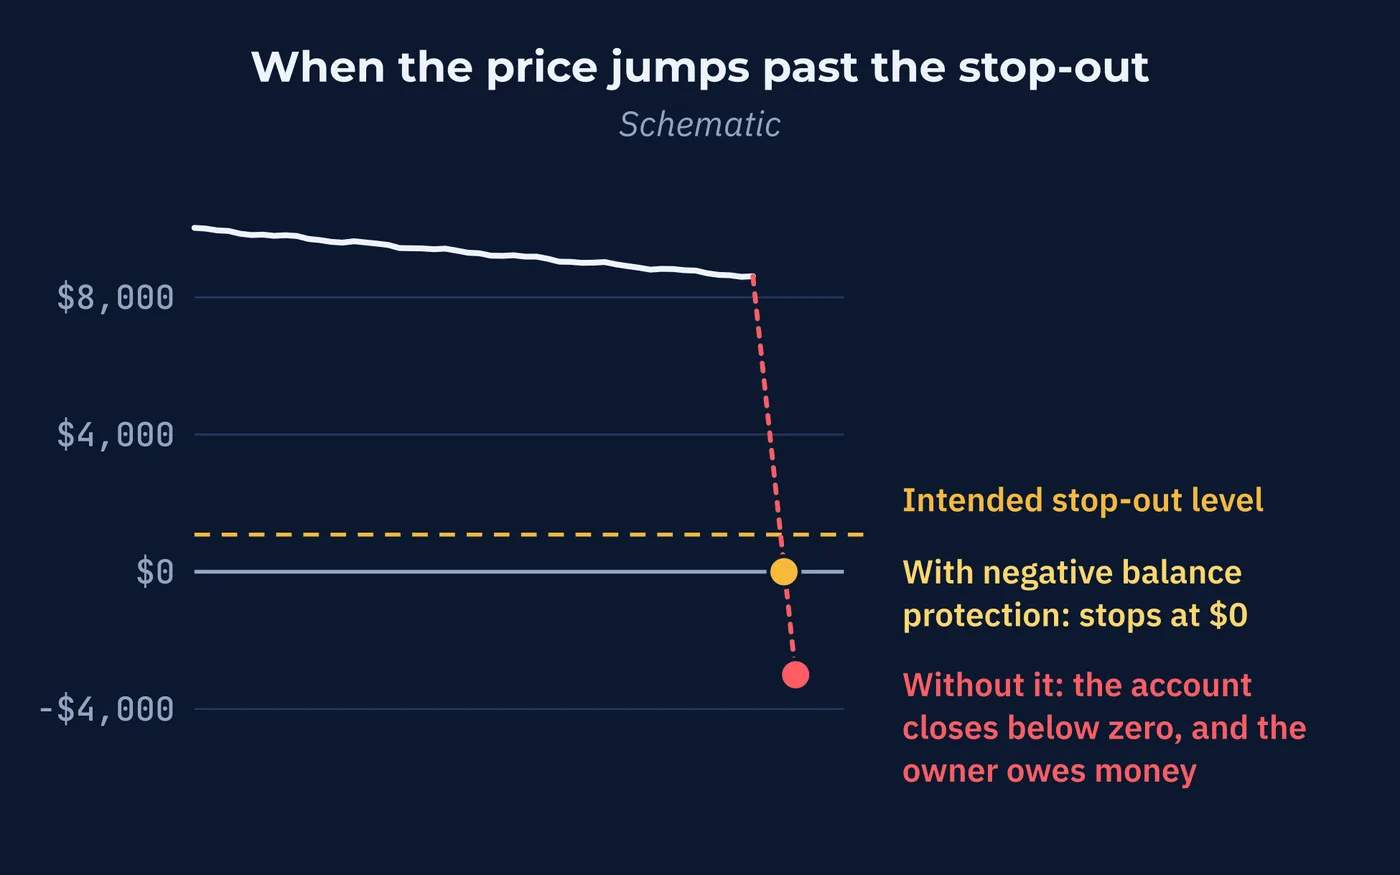
The stop-out closes your position at whatever price is available, not at the theoretical threshold. In normal conditions those are nearly the same. In a violent, gapping market they are not.
In January 2015 the Swiss National Bank abandoned the floor that had held EUR/CHF at 1.20. The reaction was immediate and enormous. EUR/CHF fell to around 0.85 within minutes, roughly 3,500 pips, with effectively no trading in between. By the end of the day it had recovered to about 1.04.
Stop-outs could not execute anywhere near their intended levels, and some accounts closed below zero. Their owners did not simply lose their deposits. They owed money.
You can now work out what a trade costs before entering it, what a pip is worth on any pair, what leverage you are actually running, how much room a position has, and where the decision to close stops being yours. None of that tells you which way a price will go. All of it decides what happens to you when you are wrong, which turns out to matter more.
Three Things to Remember
Try This
Fifteen minutes and a calculator. This is the calculation almost nobody runs.
Words From This Lesson
| Term | What It Means |
|---|---|
| Margin | Collateral held by the broker while a position is open, and returned when it closes. |
| Balance | The cash in the account, ignoring any open positions. |
| Equity | Balance adjusted for live profit or loss on open positions. The figure the broker watches. |
| Used margin | Collateral currently held against open positions. Fixed at the moment each position opens. |
| Free margin | Equity minus used margin. What remains to absorb further adverse movement. |
| Margin level | Equity divided by used margin, as a percentage. Drives the margin call and the stop-out. |
| Margin call | A warning, usually near 100%, that no new positions may be opened. |
| Stop-out | Automatic closure of positions by the broker, usually near 50%. |
| Stop loss | Your own instruction to close at a chosen price, placed before the market reaches it. |
| Negative balance protection | A safeguard ensuring an account cannot fall below zero. |
Test Your Knowledge
Eight questions. Answer them all before checking the key on the following pages. If a question gives you trouble, the answer key tells you which section to revisit.
- A. Collateral held while the position is open and returned afterward
- B. A fee charged to open a position
- C. Interest paid on borrowed money
- D. The broker's share of any profit
- A. $1,085
- B. $10,850
- C. $5,425
- D. $2,170
- A. Balance
- B. Used margin
- C. Equity
- D. Free margin
- A. Balance divided by used margin
- B. Equity divided by used margin, times 100
- C. Free margin divided by equity
- D. Position value divided by equity
- A. The smaller account has far fewer pips of room before stop-out
- B. Nothing, since the position is the same
- C. The smaller account pays more margin
- D. The larger account has a higher leverage ratio
- A. A stop-out can be canceled and a stop loss cannot
- B. A stop loss costs money and a stop-out does not
- C. They are two names for the same thing
- D. A stop loss is set by you in advance; a stop-out is triggered by the broker
- A. It stays the same until the market moves
- B. It falls immediately, before any movement
- C. It improves because risk is spread
- D. It only changes if one position loses
- A. Guarantees you cannot lose money
- B. Prevents a stop-out from happening
- C. Ensures your account cannot fall below zero
- D. Refunds losses on volatile days
Answer Key
Each answer explains why the correct choice is correct, why the others are not, and where to reread.
Question 1 · correct answer A
Margin is your own money, set aside as security while the trade is open and returned when it closes, adjusted for the result.
B treats it as an expense, which is what the word suggests and why the confusion is common. The spread is the expense. C describes a financing charge, which is a separate matter. D is wrong because brokers do not take a share of profits.
Review: Section 1, Margin Is Collateral, Not Cost
Question 2 · correct answer D
Position value divided by the leverage ratio. $108,500 divided by 50 is $2,170.
A is the maintenance threshold, which is half the required margin. C would apply at 20:1. B would apply at 10:1, and would exceed most beginner accounts.
Review: Section 2, How Much Gets Held
Question 3 · correct answer C
Equity reflects live profit and loss, so it is the live value of the account and the number thresholds are measured against.
A only changes when a position closes, so it can look healthy while the account is in trouble. B is fixed when the position opens and does not respond to the market. D is derived from equity rather than being the figure watched directly.
Review: Section 3, The Five Numbers
Question 4 · correct answer B
Equity divided by used margin, expressed as a percentage. It shows how much account value is supporting the collateral held.
A uses balance, which ignores live losses and would give a falsely reassuring figure. C and D produce numbers that no broker uses and that do not track the account's condition.
Review: Section 4, Two Thresholds
Question 5 · correct answer A
Room before stop-out is starting equity minus the threshold, divided by pip value. The $10,000 account has about 892 pips of room and the $2,500 account about 142.
B ignores the account, which is the variable that actually decides survivability here. C is wrong because required margin depends on the position, and both are identical. D confuses the ceiling offered with the exposure being run.
Review: Section 5, How Far Can It Move Against You?
Question 6 · correct answer D
You place a stop loss in advance at a level you chose. The stop-out is the broker closing your position to protect its own collateral, after the loss is already severe.
B invents a cost difference that does not exist. C treats them as equivalent, when the difference is who decides and when. A reverses the situation, since a stop loss can be moved or canceled and a stop-out cannot.
Review: Section 6, The Stop Loss Takes the Decision Back
Question 7 · correct answer B
Each position consumes used margin, so the margin level falls the moment they open. Three positions quoted against the dollar are also one bet repeated, so they lose together.
A ignores that used margin rises immediately on opening. C describes diversification, which correlated positions do not provide. D is wrong because the margin level changes as soon as collateral is committed.
Review: Section 7, Three Positions, One Bet
Question 8 · correct answer C
It caps the loss at what you deposited, so a violent move cannot leave you owing the broker money.
A overstates it enormously, since ordinary losses are entirely possible. B is wrong because it does not prevent closure, it limits the consequence. D describes a refund scheme that does not exist.
Review: Section 8, When the Stop-Out Does Not Save You
Keep going
The Real Cost & Mechanics of a Trade is written by Kanin D. Alldredge for The Currency Classroom, and it is free to read. There is more free from CNS: start here.
Start free with CNS →