Timeframes and Confluence

1The Same Market at Different Zooms
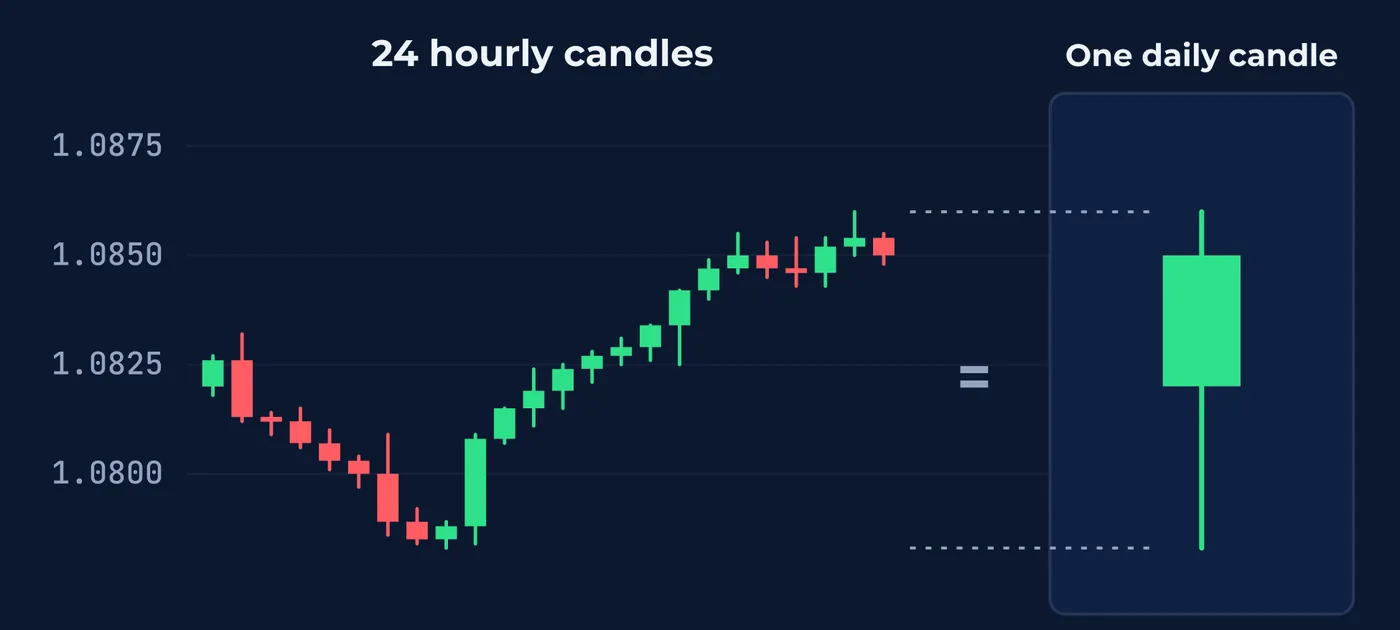
Every timeframe draws the same prices. A daily candle on a forex chart holds the same 24 hours as 24 hourly candles, and each of those hourly candles holds the same hour as 60 one-minute candles.
What changes is which movements are big enough to see. A 40-pip dip is a large event on a five-minute chart. On a daily chart it may be part of a single wick. On a weekly chart it may be invisible.
So every reading from the last five lessons depends on the timeframe it was made on. A level, a trend, a range, a stretch of disorder, the shape of a candle. Change the zoom and each one can change too.
One detail from Lesson 59 carries over. Larger candles are built on the platform's clock, so a daily or weekly candle on one platform can cover a slightly different stretch of time than on another. Two traders comparing daily or weekly charts should check that their charts end the day at the same time before deciding they disagree.
2The Standard Timeframes
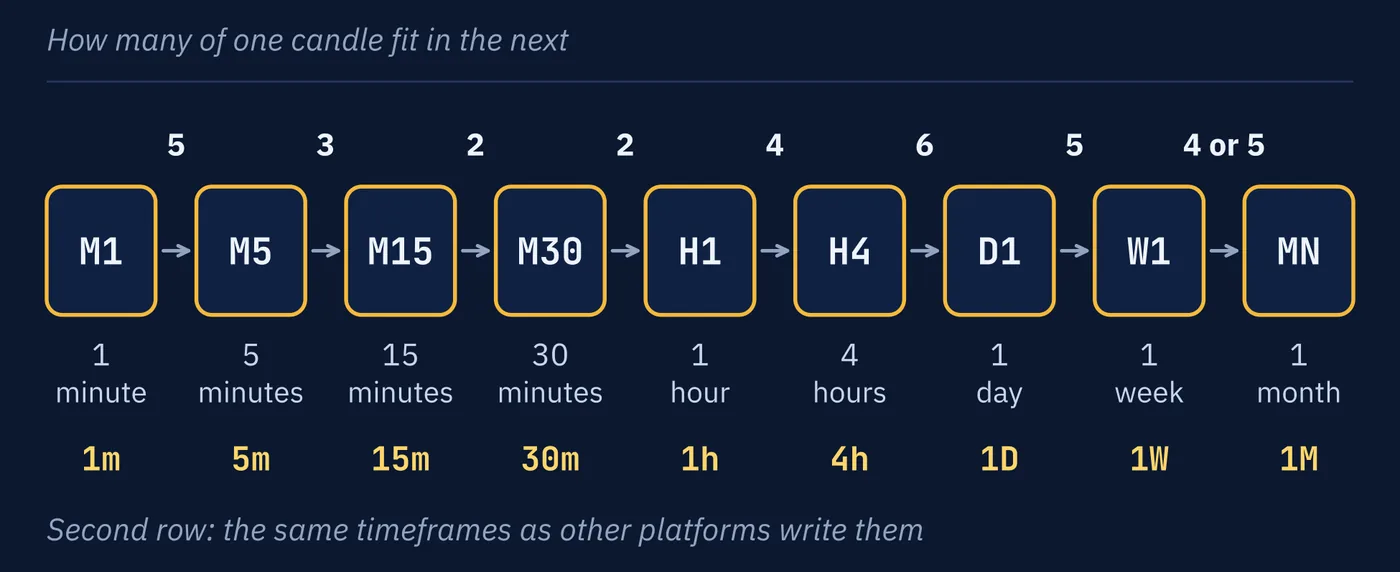
Platforms offer the same short list of timeframes, and they label them in shorthand. The most common shorthand puts a letter first and a number after it: M for minutes, H for hours, D for days, W for weeks.
| Label | Each Candle Covers | Candles in One Day |
|---|---|---|
M1 | 1 minute | 1,440 |
M5 | 5 minutes | 288 |
M15 | 15 minutes | 96 |
M30 | 30 minutes | 48 |
H1 | 1 hour | 24 |
H4 | 4 hours | 6 |
D1 | 1 day | 1 |
W1 | 1 week, which is five daily candles | |
MN | 1 month, which is four or five weekly candles |
Why four or five? It depends on the month. A week always has five weekdays. A month has between 20 and 23, depending on how long it is and which day it starts on. Twenty is exactly four weeks, and 23 is four weeks and three days. So a monthly candle always covers four weeks of trading, and in most months it runs a few days into a fifth. Weeks also do not line up with months, so a week that straddles the end of a month is split between two monthly candles.
Other platforms put the number first and write 1m, 5m, 15m, 1h, 4h, 1D and 1W. Watch one label in particular. On those platforms 1M means one month, not one minute, which is why the first style writes the monthly chart as MN.
Two more pieces of shorthand are worth knowing. HTF means higher timeframe and LTF means lower timeframe. Both are relative. H4 is the higher timeframe next to M15 and the lower timeframe next to D1.
The labels also tell you how far back a chart reaches. Say your screen shows about 200 candles.
| Chart | 200 Candles Cover |
|---|---|
M5 | About 17 hours |
H1 | About 8 trading days |
H4 | About 7 weeks |
D1 | About 9 months |
W1 | Nearly 4 years |
That is the practical meaning of zoom. A level that turned price three times in the last nine months cannot appear on an M5 screen at all. The chart does not reach back far enough to show it.
3Which Timeframe Is the Real One?
None of them. Each answers a question about a different length of time.
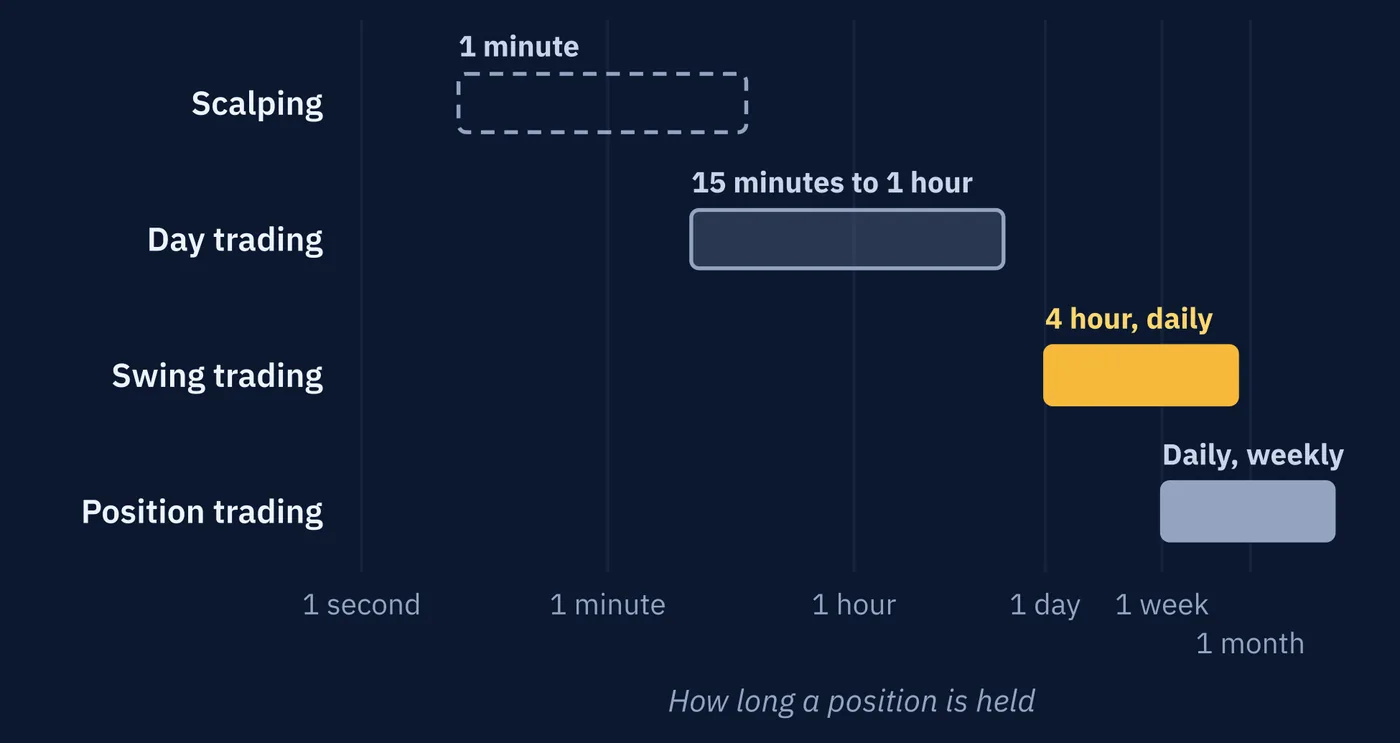
The useful question is which length of time matters to you, and that depends on how long you hold a position. Lesson 27 matched each trading style to the charts it usually reads.
| Style | Holding Period | Charts Typically Read |
|---|---|---|
| Scalping | Seconds to minutes | 1 minute |
| Day trading | Minutes to hours | 15 minutes to 1 hour |
| Swing trading | Days to weeks | 4 hour, daily |
| Position trading | Weeks to months | Daily, weekly |
A downtrend on the hourly chart matters a great deal to a day trader and very little to a position trader holding for three months. Both are looking at the same market. They are asking about different stretches of its future.
4Reading From the Top Down
A common way to use several timeframes is called top-down analysis. The trader starts on a larger timeframe to see the overall structure, then moves to smaller ones for detail.
Reading more than one timeframe at all is called multi-timeframe analysis, often shortened to MTF. Top-down is the most common order to do it in.
A swing trader might start on the weekly chart to see the broad trend and the major levels, move to the daily chart to see the current state, and finish on the four-hour chart to see exactly where price sits relative to a level. Lesson 27 described swing traders using the busy session opens to confirm something already found on a higher timeframe. This is that process.
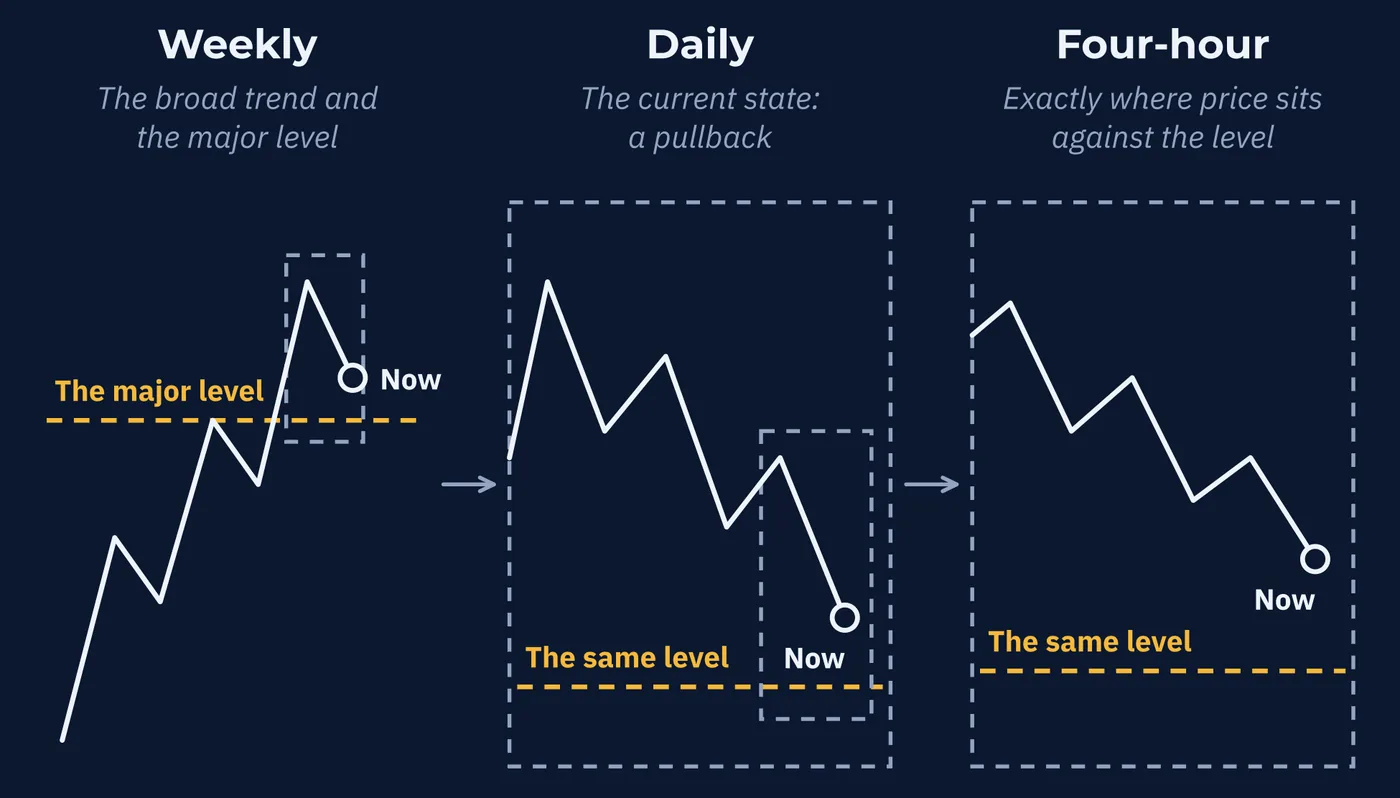
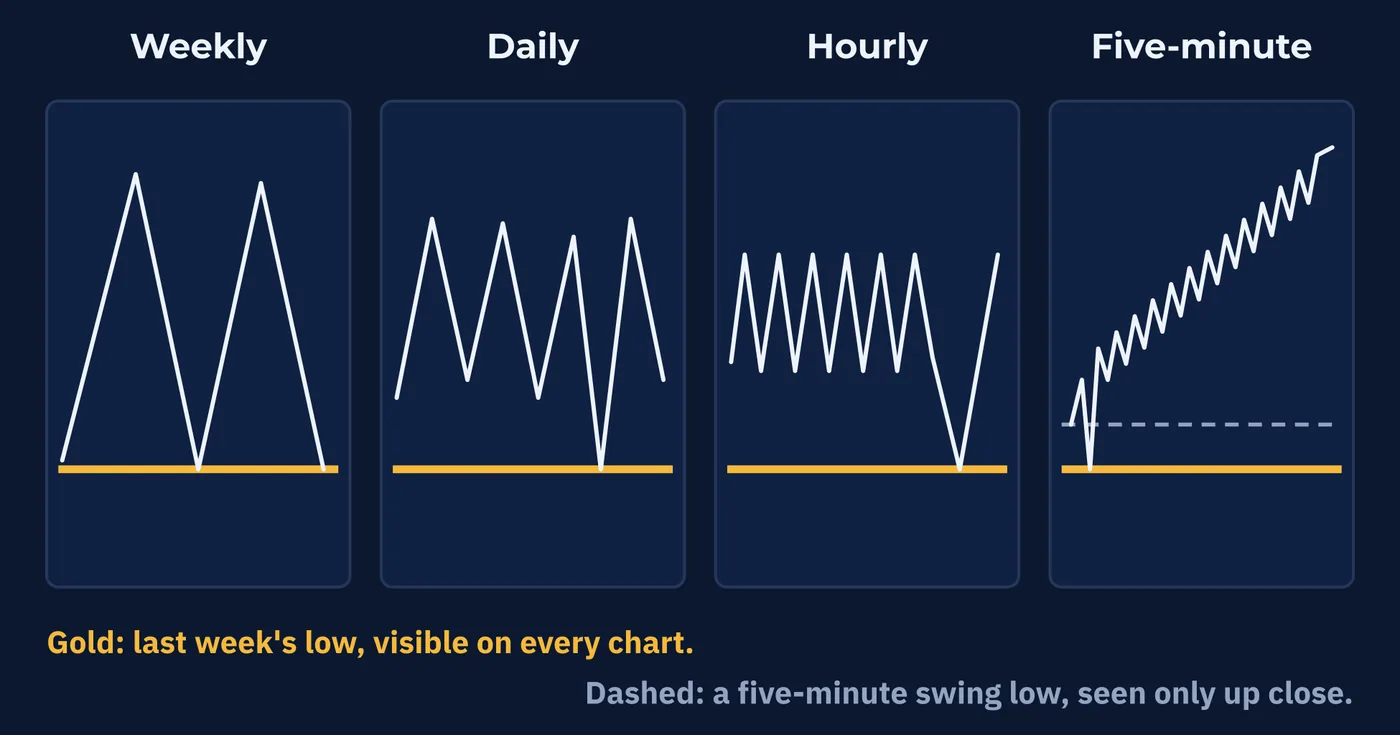
and the gold line is the same level in all three.
One well-known version is the Triple Screen method described by Alexander Elder in his 1993 book Trading for a Living. It reads three timeframes, often weekly, daily, and hourly for a trader holding for several days. Elder held that trends on neighboring timeframes tend to be related by a factor of about five.
Top-down reading is a widely taught habit, and it has a sensible logic: see the big picture before the details. It is worth being clear that the habit, and the factor of five, are traditions of practice. They have not been established by careful testing.
5How to Choose Your Timeframes
Top-down reading needs a set of timeframes, and the set should be chosen once, not chart by chart. Here is a common way to choose it. Like the factor of five, it is a convention.
Start with your trading timeframe. This is the chart you make decisions on, and it follows from how long you hold. If a trade usually lasts a few days, a daily candle is a sensible unit, so the trading timeframe is D1.
Add one higher, for context. Go up by a factor of about four to six. Its job is the overall state and the major levels from Lesson 55.
Add one lower, for detail. Go down by about the same factor. Its job is to show what price is doing right at a level.
| Style | Higher, for Context | Trading Timeframe | Lower, for Detail |
|---|---|---|---|
| Scalping | M15 | M5 | M1 |
| Day trading | H4 | H1 | M15 |
| Swing trading | W1 | D1 | H4 |
| Position trading | MN | W1 | D1 |
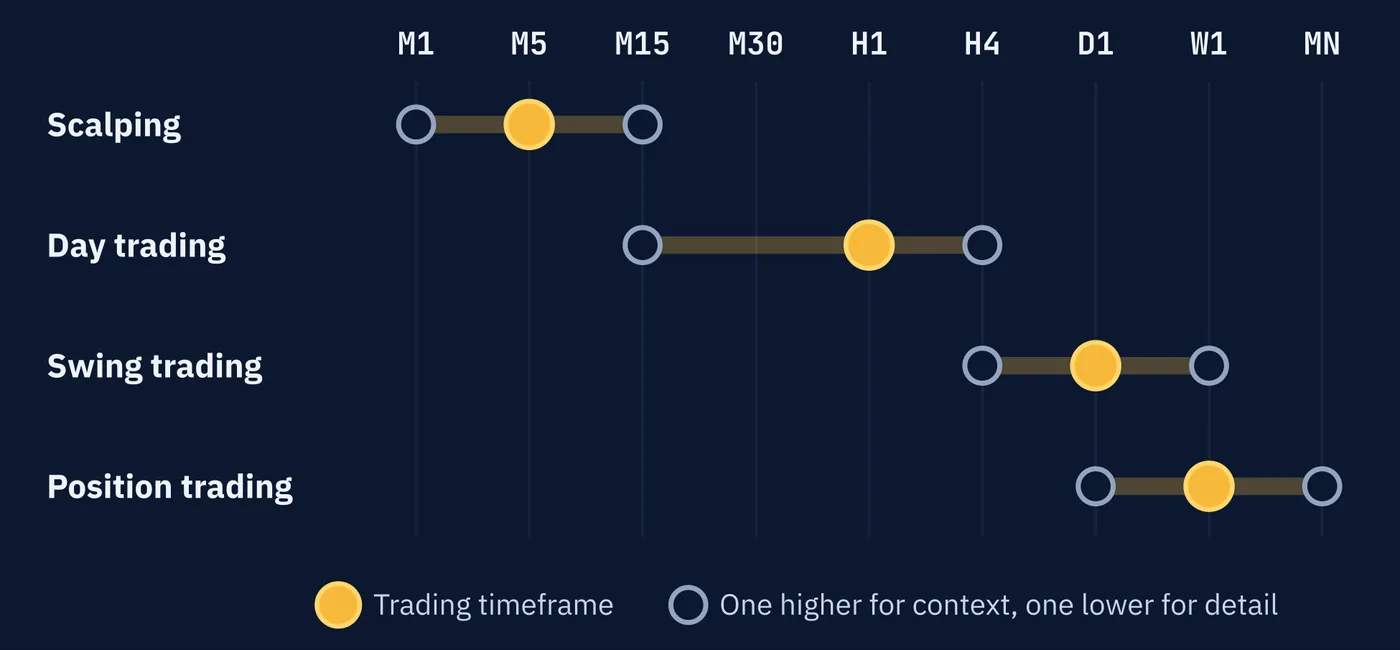
Work one through. Say your trades usually last two to four hours. An hourly candle is a sensible unit, so the trading timeframe is H1. One higher by a factor of four is H4. One lower by a factor of four is M15. Record H4, H1, M15, in that order, and read them in that order every time.
Three things make a set work.
Three is enough. Two is the minimum. A fourth and a fifth add little, and Section 11 explains what they cost.
Keep neighbors four to six times apart. H1 and M30 are nearly the same chart, so reading both tells you one thing twice. W1 and M5 are so far apart that everything in between goes unseen.
Give each chart one job. Context on the higher one, the reading on the trading timeframe, detail on the lower one. A level found on M15 should not overrule a state read on H4.
6A Top-Down Read, Start to Finish
Here is the whole series used at once, on an illustrative GBP/USD chart with a swing trader's set: W1, D1, H4. Each chart is run through the routine from Lesson 58 with a 20-pip tolerance.
| Chart | Highs, in Order | Lows, in Order | Reading |
|---|---|---|---|
W1 | 1.2710 1.2890 1.3050 | 1.2480 1.2650 1.2820 | Uptrend |
D1 | 1.3050 1.3038 1.3046 | 1.2898 1.2905 1.2912 | Range |
H4 | 1.3046 1.3010 1.2975 | 1.2962 1.2931 1.2905 | Downtrend |
Price is now at 1.2915.
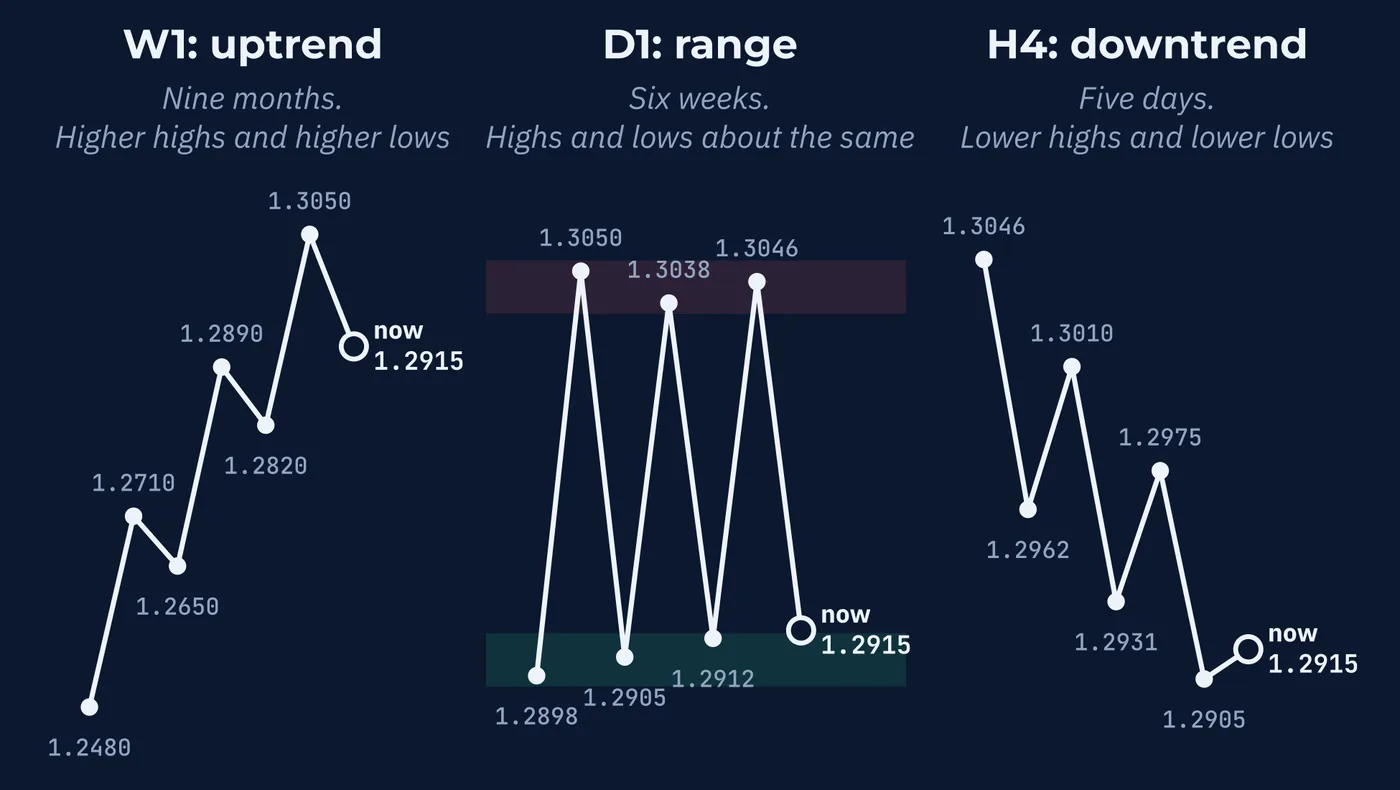
W1, for context. Higher highs and higher lows over nine months. The last higher low is 1.2820, and a fall below it would end the uptrend under Lesson 56's definition.
D1, the trading timeframe. For six weeks price has turned down near 1.3045 and up near 1.2900. That is a range about 145 pips wide, sitting just under the weekly high. Its midpoint is about 1.2970, and its bottom edge is on a round number.
H4, for detail. Lower highs and lower lows for five days. Its last lower high is 1.2975.
Now put the three together. The four-hour downtrend is price crossing the daily range from its top edge to its bottom edge. The daily range is a pause in the weekly uptrend, or the place it ends, and Lesson 57 said nobody can tell which from inside. Price is 15 pips above the bottom edge.
A trader would record it in one line. GBP/USD: W1 up, D1 range 1.2900 to 1.3045, H4 down inside it, price at the range low. That sentence took six lessons to be able to write, and every part of it can be checked against a chart. It still does not say what happens next. It says where the next decision is.
7When Timeframes Disagree
They disagree constantly, and that is normal.
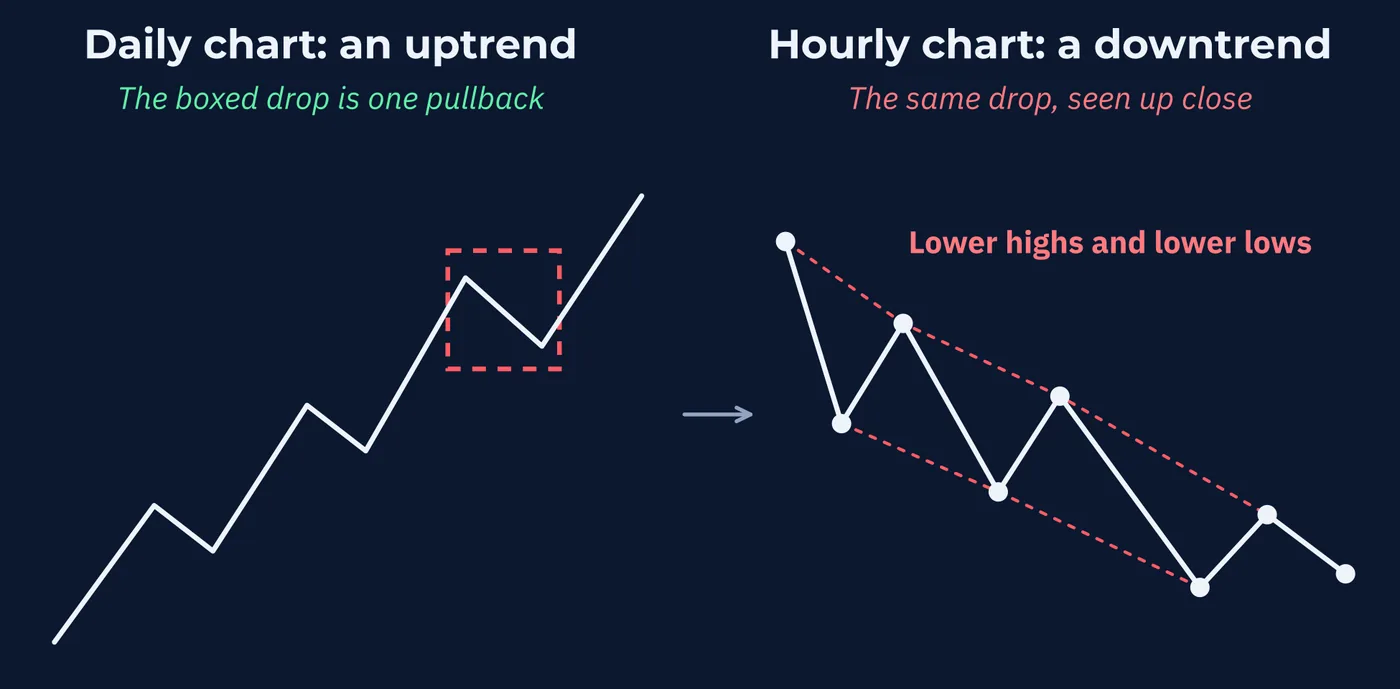
Picture a daily uptrend. Lesson 56 showed that every uptrend is made of pullbacks. On the hourly chart, each of those pullbacks can look like a downtrend of its own, with lower highs and lower lows lasting a day or two. Neither chart is wrong. The hourly downtrend is the daily pullback, seen up close.
| Daily Chart Shows | Hourly Chart Shows | What Is Happening |
|---|---|---|
| Uptrend | Uptrend | Both timeframes agree |
| Uptrend | Downtrend | A pullback inside the larger trend, or the start of its end |
| Range | Trend | Price crossing from one edge of the larger range to the other |
| Uptrend | Disorder | A messy stretch inside the larger trend |
Notice the second row. A pullback and the start of a reversal look the same while they are happening, as Lesson 56 explained. Reading both timeframes does not solve that. It just shows you the question more clearly.
Disagreement is information. It tells you the market is doing different things over different stretches of time, which is almost always true.
When every timeframe a trader reads gives the same reading, the timeframes are said to be aligned. It is the first row of the table. It is also the rarest.
8Levels Across Timeframes
Traders commonly treat a level that shows up on a weekly or daily chart as more important than one that only shows up on a five-minute chart.
The reasoning connects to Lesson 55. A level on a larger timeframe is visible to traders of every style, since even a scalper can see a weekly low. It may also hold orders from participants with longer horizons and larger positions. A level visible only on a five-minute chart is seen by fewer people, and it may last only hours.
That reasoning is plausible. It has not been measured in any way this course can point to. Treat larger-timeframe levels as more widely watched, which is very likely true, rather than as proven to hold more often.
The previous-period levels from Lesson 55 are higher-timeframe levels by construction. Last week's high is the high of the last finished W1 candle, and it sits at the same price on every chart below it.
The example in Section 6 shows the pattern. The weekly chart supplies 1.2820 and 1.3050. The daily chart adds the range edges near 1.2900 and 1.3045. The four-hour chart adds 1.2975, which matters for a few days at most. A level passes down to every chart below the one it was found on. It does not pass up.
9Confluence
When several separate reasons point to the same price or the same conclusion, traders call it confluence. The word means a flowing together, as when two rivers meet.
Here is an illustrative example on EUR/USD, built from the level in Lesson 55.
| Reason | Price | Timeframe |
|---|---|---|
| Bottom edge of a daily range | 1.0797 to 1.0810 | Daily |
| Round number | 1.0800 | Any |
| Last week's low | 1.0805 | Weekly |
| Recent swing low on the four-hour chart | 1.0798 | 4 hour |
Four reasons, all within about 15 pips of 1.0800. A trader would say the area has a lot of confluence, and many would treat that as making it more significant than a level with only one reason behind it.
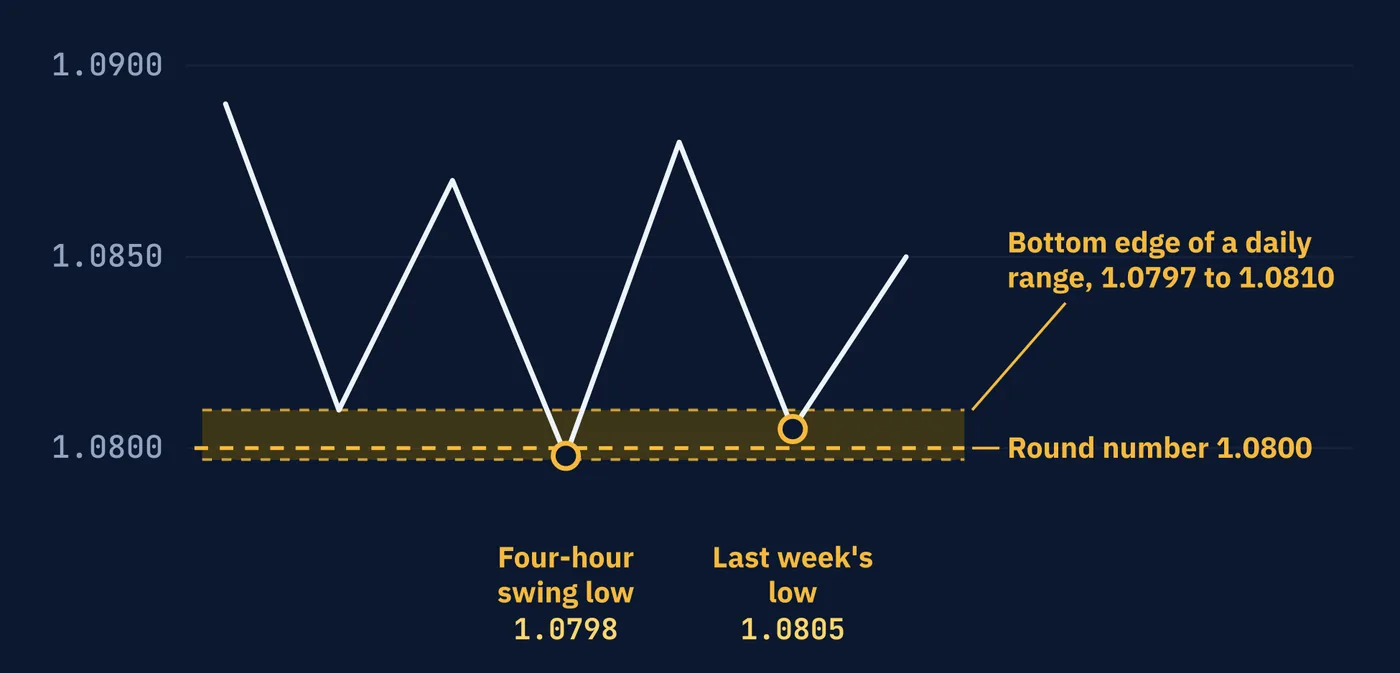
It is easy to see why traders look for this. Any single reason is weak on its own. Lesson 55 showed that a level can stall price or break, and the same orders support both outcomes. More reasons feel as though they should tilt the odds.
That conclusion depends entirely on whether the four reasons are really four.
10Counting Reasons Honestly
Confluence adds information only when the reasons are independent, meaning each one could have been true without the others.
Look at the table again. The daily range low formed at 1.0800 partly because, as Lesson 55 explained, orders gather at round numbers. So the round number and the range low are largely the same reason. Last week's low was one of the touches of the daily range, so it is the same reason a third time. The four-hour swing low is that same touch, seen at a closer zoom.
Four entries in the table. Arguably one underlying fact: orders tend to sit near 1.0800.
Asking the same witness four times is not four witnesses.
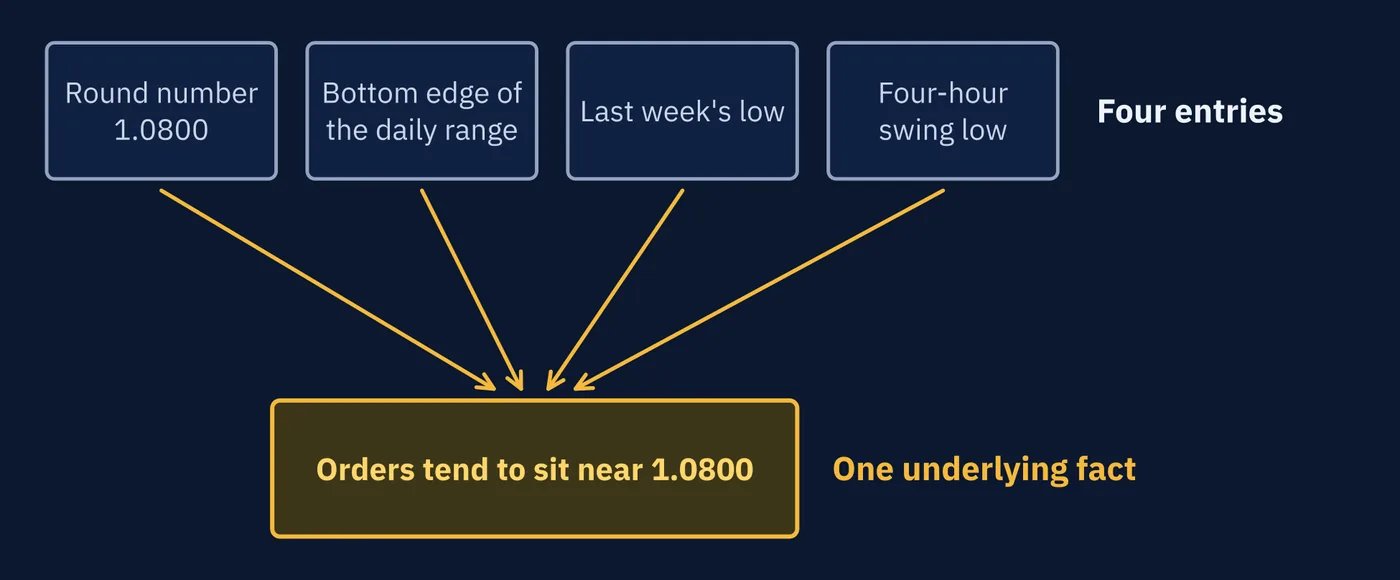
That does not make the area unimportant. One good reason is still a reason. It means the feeling of four reasons is stronger than the evidence of four reasons, and the gap between them is easy to miss.
An independent reason comes from somewhere else. A central bank decision due that afternoon would be true whether or not 1.0800 had ever turned price. A second line drawn through the same touches would not.
Run the same count on Section 6. At 1.2900 there is the bottom edge of the daily range, a round number, and a four-hour swing low at 1.2905. That is three entries. The swing low is the range's latest touch, and the range edge formed on the round number. An honest count is one.
The same problem returns throughout the course. Lesson 67 looks at what happens when several indicators built from the same prices are combined, and Lesson 108 looks at when confluence turns into an excuse.
11The More You Look
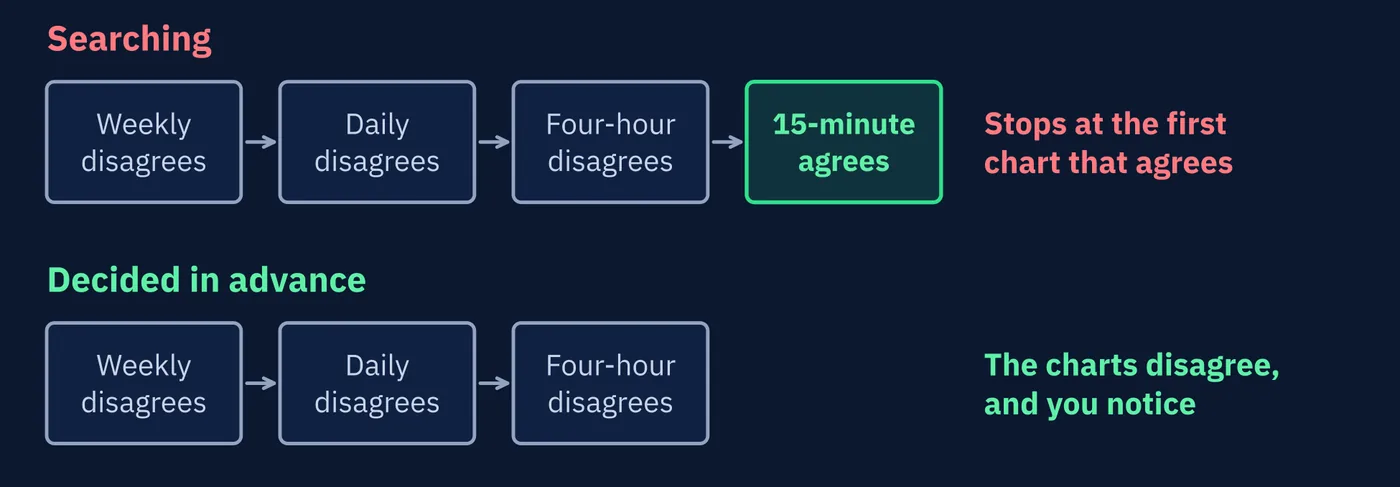
There is a quieter risk in reading many timeframes. The more charts you check, the more likely you are to find one that agrees with whatever you already wanted to do.
Psychologists have studied this tendency for decades and call it confirmation bias. People notice, seek out, and give weight to information that supports what they already believe, and pass over what does not. It is one of the most thoroughly documented habits of human reasoning, and nobody is immune to it.
That completes the structure layer: levels, trends, ranges, disorder, single candles, and timeframes. All of it is read from price alone. The next series looks at indicators, the tools traders build from price, beginning with what an indicator is and what it is not.
Three Things to Remember
Try This
Thirty minutes. Do Step 1 before you open any chart.
Words From This Lesson
| Term | What It Means |
|---|---|
| Timeframe label | Shorthand for how much time each candle covers, such as M5, H1, H4, D1 and W1. |
| Higher timeframe | A chart in which each candle covers more time, such as daily compared with hourly. Often shortened to HTF. |
| Lower timeframe | A chart in which each candle covers less time, showing more detail over a shorter stretch. Often shortened to LTF. |
| Multi-timeframe analysis | Reading more than one timeframe of the same market. Often shortened to MTF. |
| Top-down analysis | Reading a market from the largest timeframe down to the smallest. |
| Trading timeframe | The chart a trader makes decisions on, chosen to fit how long trades are held. |
| Aligned | Said of timeframes that all give the same reading. |
| Triple Screen | A top-down method that reads three timeframes, described by Alexander Elder. |
| Confluence | Several separate reasons pointing to the same price or conclusion. |
| Independent reasons | Reasons that could each be true without the others, so each adds new information. |
| Confirmation bias | The tendency to seek and favor information that supports what you already believe. |
Test Your Knowledge
Ten questions. Answer them all before checking the key on the following pages. If a question gives you trouble, the answer key tells you which section to revisit.
- A. Each candle covers four hours, and four make one day
- B. Each candle covers four hours, and six make one day
- C. Four candles are drawn every hour
- D. The fourth hour of the trading day
- A. Always the daily
- B. Always the shortest available
- C. None of them; each describes a different stretch of time
- D. Whichever shows an uptrend
- A. Reading only the largest timeframe
- B. Trading only from the highs of the day
- C. Reading charts from the top of the screen to the bottom
- D. Starting on a larger timeframe for structure and moving to smaller ones for detail
- A. As a law proven by research
- B. As a rule required by brokers
- C. As a tradition of practice that has not been established by careful testing
- D. As the number of trades to take each week
- A. W1, D1, H4
- B. D1, H4, H1, M30, M15
- C. H1, M30, M15
- D. MN, D1, M5
- A. Price crossing the daily range from one edge toward the other
- B. A sign that one of the charts is wrong
- C. Proof that the weekly uptrend has ended
- D. A new weekly downtrend
- A. One of the charts is broken
- B. A pullback inside the larger trend, or possibly the start of its end
- C. The uptrend has definitely ended
- D. The hourly chart should be ignored
- A. Two currencies moving together
- B. A period of low volatility
- C. Several separate reasons pointing to the same price or conclusion
- D. A type of candle
- A. Round numbers never matter
- B. The range low and last week's low may have formed there because of the orders at the round number
- C. Weekly charts are less accurate
- D. Three reasons is always too many
- A. Decide and record in advance which timeframes you will read and in what order
- B. Check as many timeframes as possible
- C. Only trade when every timeframe agrees
- D. Avoid higher timeframes
Answer Key
Each answer explains why the correct choice is correct, why the others are not, and where to reread.
Question 1 · correct answer B
H stands for hours, so each H4 candle covers four hours. A day has 24 hours, and 24 divided by 4 is six.
A has the right meaning and the wrong count. C turns the label upside down. D reads the number as a time of day, which no timeframe label describes.
Review: Section 2, The Standard Timeframes
Question 2 · correct answer C
Each timeframe answers a question about a different length of time. The one that matters depends on how long you hold a position.
A and B each privilege one timeframe without reason. D picks the answer you want, which is the bias Section 11 describes.
Review: Section 3, Which Timeframe Is the Real One?
Question 3 · correct answer D
Top-down analysis starts on a larger timeframe to see the overall structure, then moves to smaller timeframes for detail.
A stops at the first step. C and B misread the name.
Review: Section 4, Reading From the Top Down
Question 4 · correct answer C
The lesson presents top-down reading and the factor of five as widely taught traditions with a sensible logic, not as tested results.
A overstates the evidence. B and D are invented.
Review: Section 4, Reading From the Top Down
Question 5 · correct answer A
The trading timeframe is D1. One higher by about five is W1, and one lower by about six is H4. Three charts, each four to six times apart.
D leaves gaps so wide that everything between the charts goes unseen. B reads five charts, several of them nearly the same. C has no chart above the trading timeframe and does not include D1 at all.
Review: Section 5, How to Choose Your Timeframes
Question 6 · correct answer A
A trend on the lower timeframe inside a range on the higher one is usually price traveling from one edge of that range toward the other.
C and D read a four-hour move as a weekly one, and the weekly uptrend stands until its last higher low breaks. B treats disagreement as an error, when all three readings can be true at once.
Review: Section 6, A Top-Down Read, Start to Finish
Question 7 · correct answer B
Every uptrend is made of pullbacks, and on a smaller timeframe each pullback can look like a downtrend of its own. While it is happening, it could also be the start of the end.
A assumes disagreement means an error. C goes beyond what the charts show. D throws away information.
Review: Section 7, When Timeframes Disagree
Question 8 · correct answer C
Confluence is several separate reasons pointing to the same price or conclusion.
A describes correlation, covered in Series I. B describes a quiet market. D is unrelated.
Review: Section 9, Confluence
Question 9 · correct answer B
Orders gather at round numbers, which is why a range low can form there, and last week's low may simply be one of the range's touches. The entries can share one cause.
A contradicts Lesson 55. C invents a problem with weekly data. D misses the point, which is about independence, not number.
Review: Section 10, Counting Reasons Honestly
Question 10 · correct answer A
Deciding and recording your timeframes in advance means the charts can disagree with you, and you will notice when they do.
B makes the problem worse, since more charts means more chances to find agreement. C and D are not what the lesson suggests.
Review: Section 11, The More You Look
Keep going
Reading Price Structure is written by Kanin D. Alldredge for The Currency Classroom, and it is free to read. There is more free from CNS: start here.
Start free with CNS →