Trends, and When One Has Ended

1Up, Down, or Neither
Show almost anyone a chart and ask which way it is going, and they will answer in a second. The eye is good at seeing direction.
The trouble starts when two people look at the same chart and give different answers, or when one person looks at the same chart on Monday and again on Wednesday and reaches a different conclusion. A feeling about direction cannot be checked. A definition can.
Here is a run of turning points on an illustrative EUR/USD chart.
| Turning Point | Price | Compared With the Last One |
|---|---|---|
| Low | 1.0720 | Starting point |
| High | 1.0860 | Starting point |
| Low | 1.0790 | Higher low |
| High | 1.0940 | Higher high |
| Low | 1.0870 | Higher low |
| High | 1.1010 | Higher high |
Every high is above the high before it, and every low is above the low before it. That pattern is the most widely used definition of a trend, and the rest of this lesson works from it.
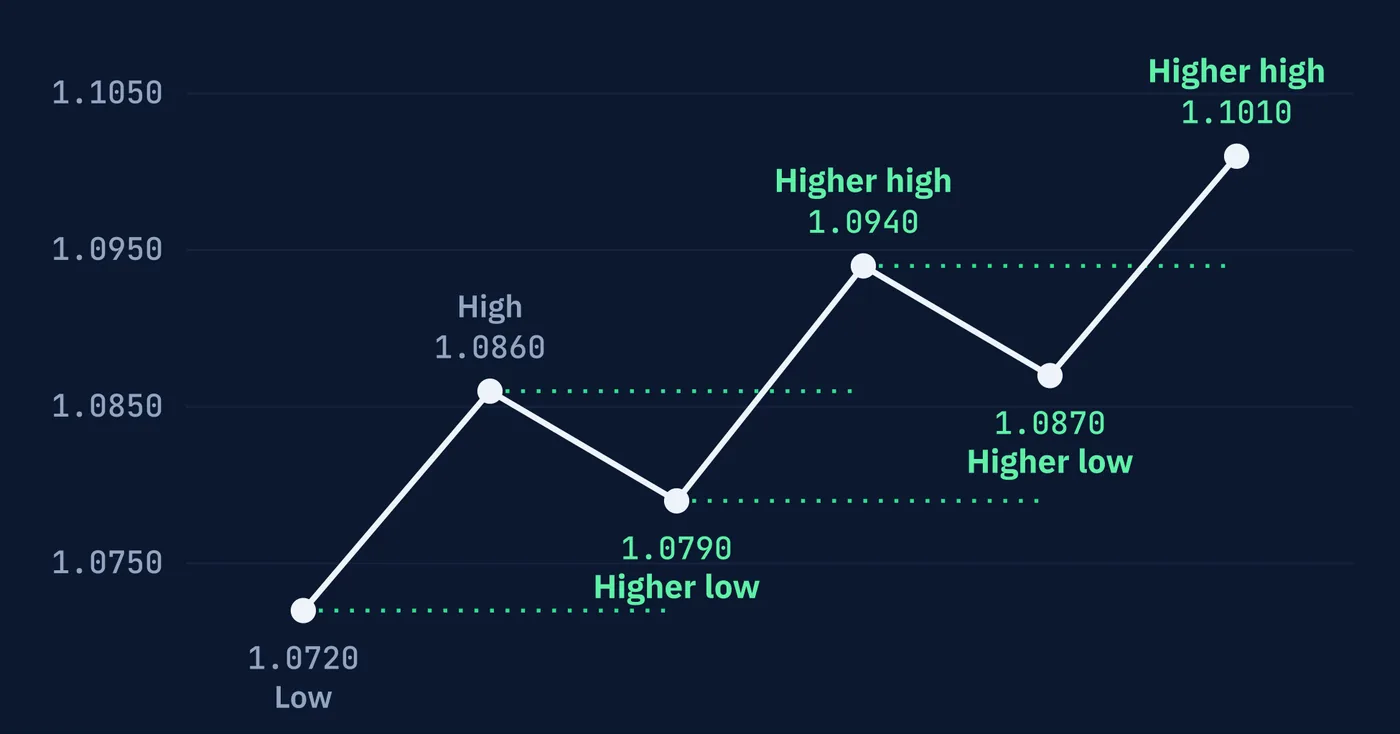
one beats.
2The Definition
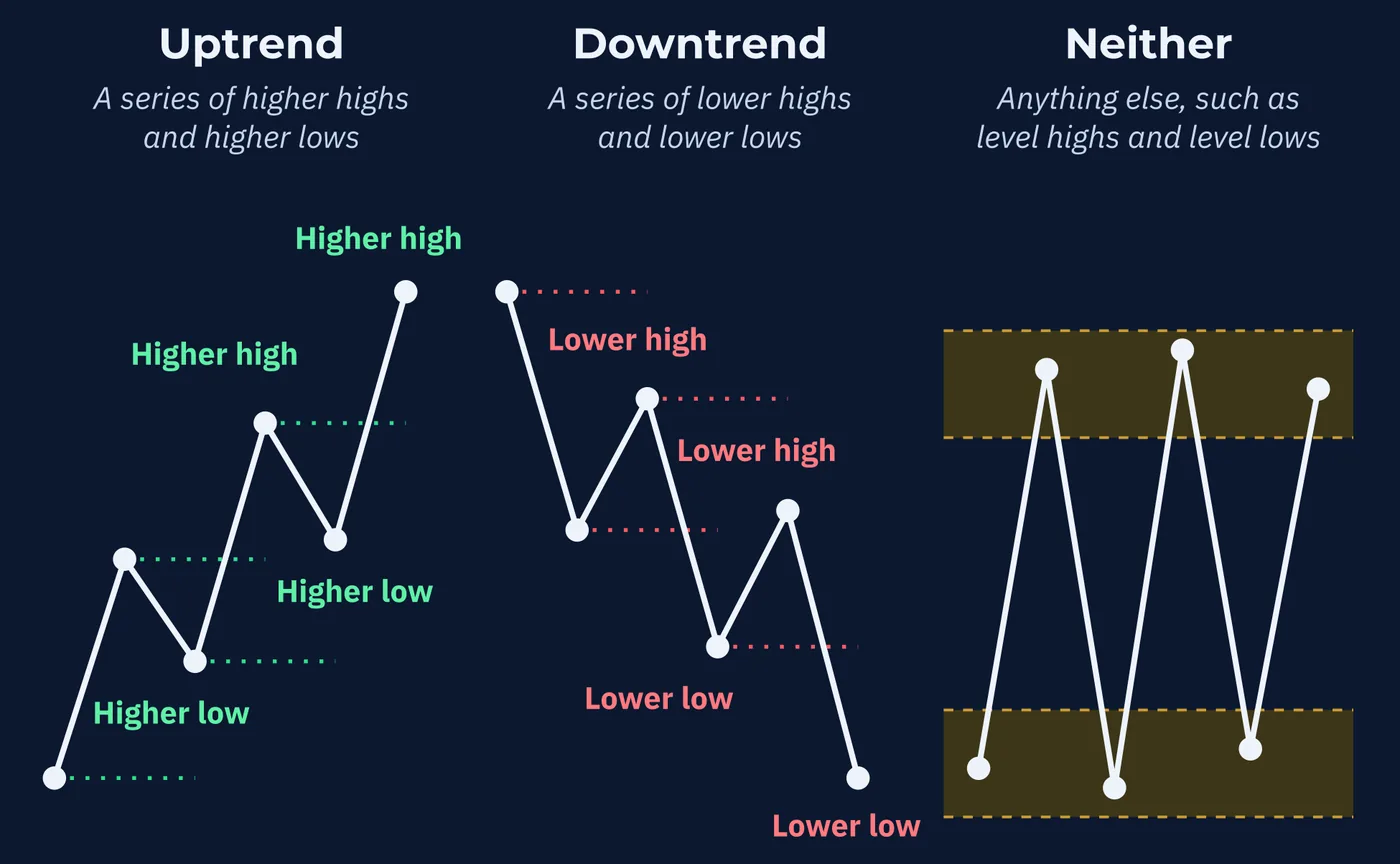
An uptrend is a series of higher highs and higher lows. A downtrend is a series of lower highs and lower lows.
Anything else is neither. If the highs are roughly level and the lows are roughly level, price is moving sideways between two levels, which is the subject of the next lesson. If the highs are rising while the lows are falling, or the other way around, the chart is not saying anything clear about direction.
Notice what the definition leaves out. It says nothing about how fast price is moving, how steep the chart looks, or how long the move has lasted. A slow, grinding climb that keeps making higher highs and higher lows is a trend. A sharp spike that makes one high and collapses is not.
3What Counts as a Turning Point
The definition depends on turning points, which traders call swing highs and swing lows. A swing high is a peak with lower prices on both sides of it. A swing low is a trough with higher prices on both sides.
That sounds precise until you open a chart. Every small wiggle is a peak with lower prices on both sides. So is every large turn. Which ones count?
Traders use rules to decide. One common rule treats a candle as a swing high only if its high is above the highs of the two candles on each side of it. Others require a minimum distance between swings, or simply use judgment about which turns look significant.
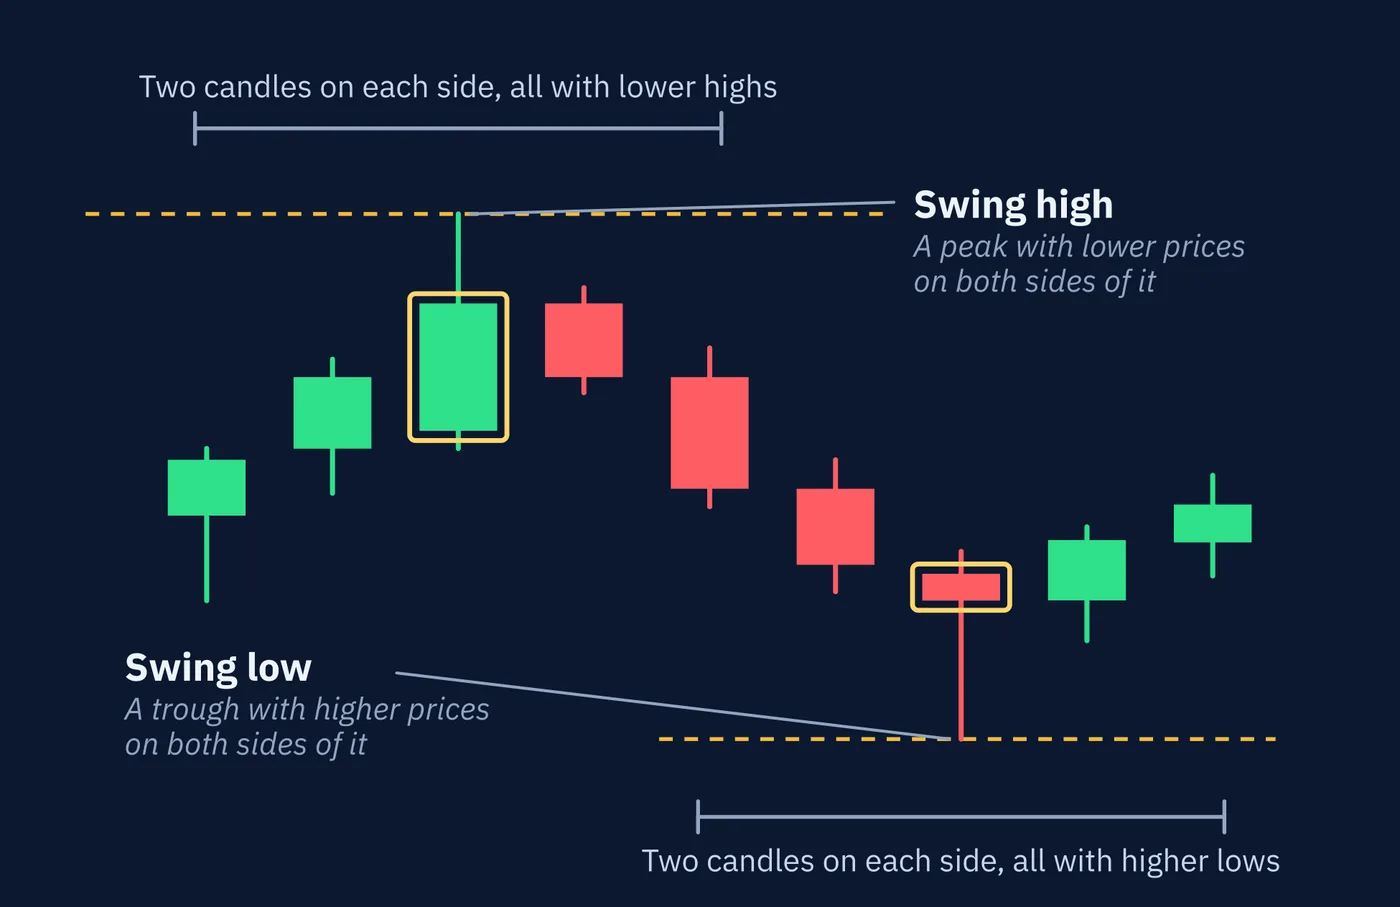
candles on either side.
Each rule gives a different set of turning points, and so a different answer about the trend. Count the small swings on an hourly chart and EUR/USD might be in a downtrend. Count the large swings on a daily chart and it might be in an uptrend. Both readings can be correct at once, because they describe different things. Lesson 60 looks at how traders handle more than one timeframe.
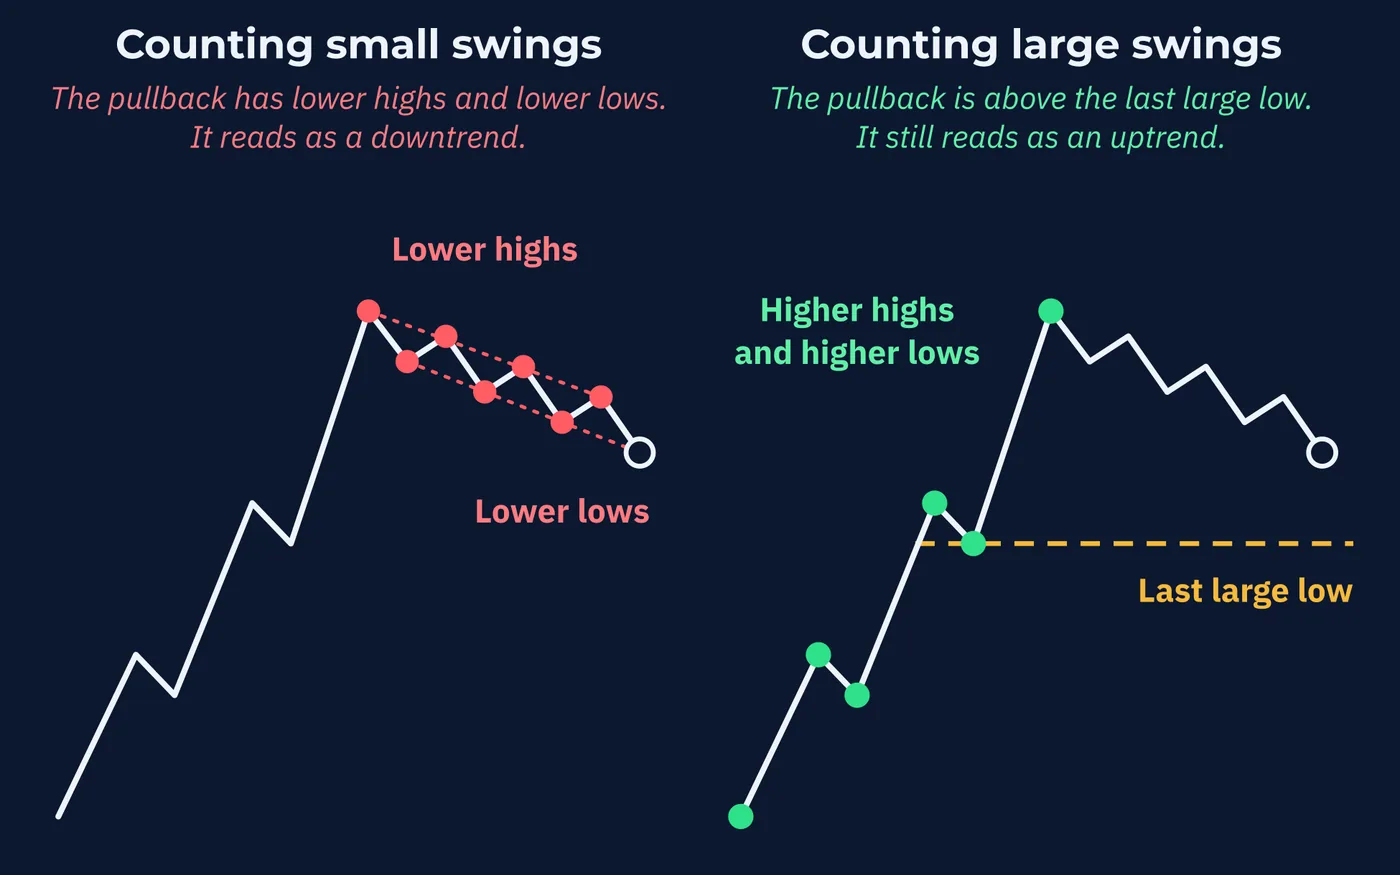
swings, it is part of an uptrend.
4Where the Idea Came From
The higher-highs definition is older than any currency chart you will look at.
It traces to Charles Dow, a founder of Dow Jones & Company, Inc. and the first editor of The Wall Street Journal, who wrote about the stock market averages in the years before his death in 1902. William Peter Hamilton, a later editor of the same paper, carried the ideas forward in his editorials, and Robert Rhea set them out as a system in a 1932 book. The result became known as The Dow Theory.
One of its central principles is the one this lesson is built on. A trend should be treated as still in place until there is a definite sign that it has reversed. Not a feeling that it has gone too far. Not a strong candle against it. A definite sign.
Dow was writing about stock averages, not exchange rates. The definition carried over to other markets because it describes price, and every market has price.
5Three Sizes of Trend
Dow's followers also had an answer to the size problem from Section 3. They did not pick one size. They named three, all going on at once.
| Name | What It Is | Usual Length in the Stock Averages |
|---|---|---|
| Primary trend | The main direction | Months to years |
| Secondary trend | A move against the primary trend. Also called a secondary reaction | Three weeks to a few months |
| Minor trend | Day-to-day movement | Days to about three weeks |
Dow compared the market to the sea, and later writers settled on the picture of a tide, with waves on the tide and ripples on the waves.
Those lengths describe stock averages a century ago, and currency traders do not hold to them. What they kept is the nesting. Every trend sits inside a larger one and has smaller ones inside it.
Say EUR/USD has climbed from 1.0500 to 1.1000 over five months on the daily chart, in higher highs and higher lows. For the last six weeks it has fallen from 1.1000 to 1.0850, in lower highs and lower lows on the four-hour chart. Today it is up 30 pips.
Which way is the trend? Primary up, secondary down, minor up. All three are true at once. The question has one answer only when you say which size you mean.
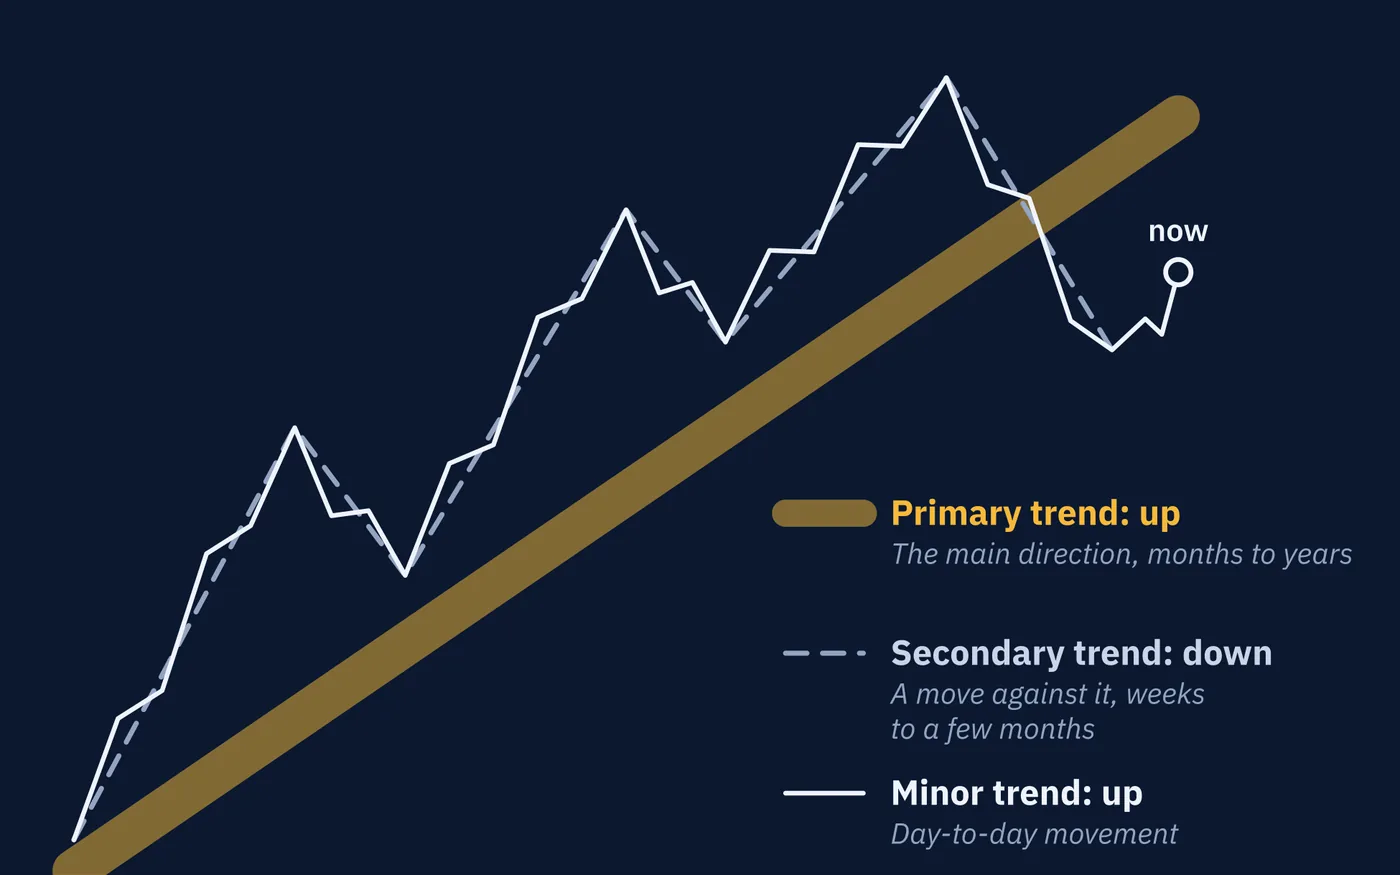
minor trend is up.
6The Legs of a Trend
Each move from one turning point to the next is called a leg. A trend has two kinds. A leg that travels with the trend is an impulse. A leg that travels against it is a correction, also called a retracement.
Here are the five legs of the uptrend from Section 1.
| Leg | From | To | Length | Kind |
|---|---|---|---|---|
| 1 | 1.0720 | 1.0860 | 140 pips up | Impulse |
| 2 | 1.0860 | 1.0790 | 70 pips down | Correction |
| 3 | 1.0790 | 1.0940 | 150 pips up | Impulse |
| 4 | 1.0940 | 1.0870 | 70 pips down | Correction |
| 5 | 1.0870 | 1.1010 | 140 pips up | Impulse |
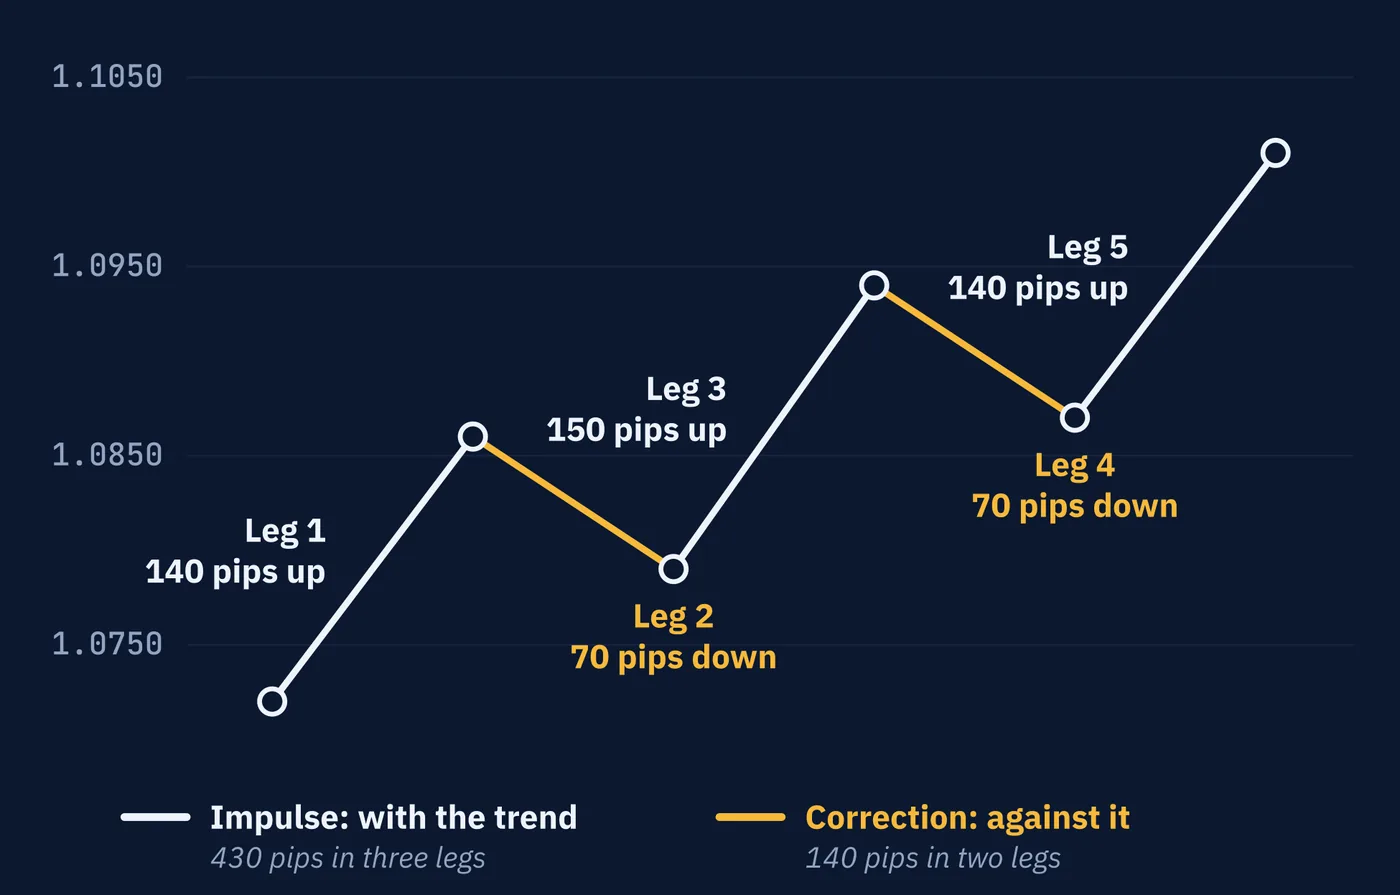
The three impulses covered 430 pips. The two corrections gave back 140. What is left is the 290 pips from 1.0720 to 1.1010.
Two questions are worth asking of any trend. Are the impulses longer than the corrections? Here they are about twice as long. And how deep is each correction, measured against the impulse before it? Leg 2 took back 70 of 140 pips, which is half. Leg 4 took back 70 of 150, a little under half.
Dow's followers expected a secondary correction to take back between one-third and two-thirds of the move before it. That describes what was common. It is not a rule. Lesson 66 looks at the Fibonacci numbers many traders use to measure corrections.
Depth connects straight back to the definition. A correction that takes back the whole impulse before it has returned to the last higher low. One step further and the uptrend is over. So corrections that keep getting deeper are worth noticing well before that.
In a downtrend everything turns over. The impulses point down, and the corrections are rallies.
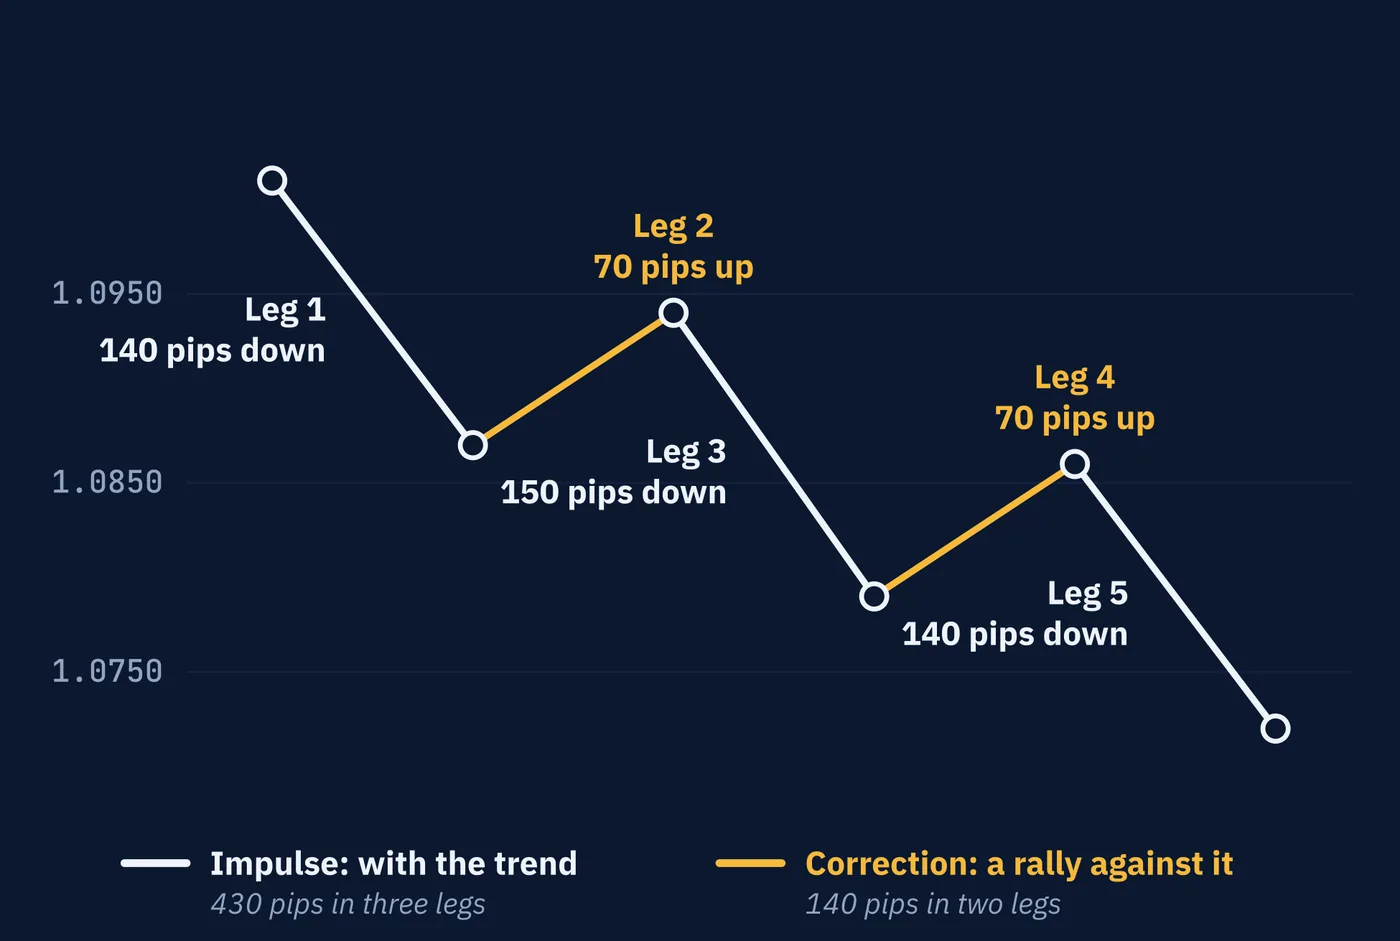
are rallies.
7Trend Lines and Channels
A trend line is a straight line drawn along the turning points of a trend. In an uptrend it goes under the swing lows. In a downtrend it goes over the swing highs. Lesson 55 called it a sloping level, and that is how traders use it: as support that rises with the trend, or resistance that falls with it.
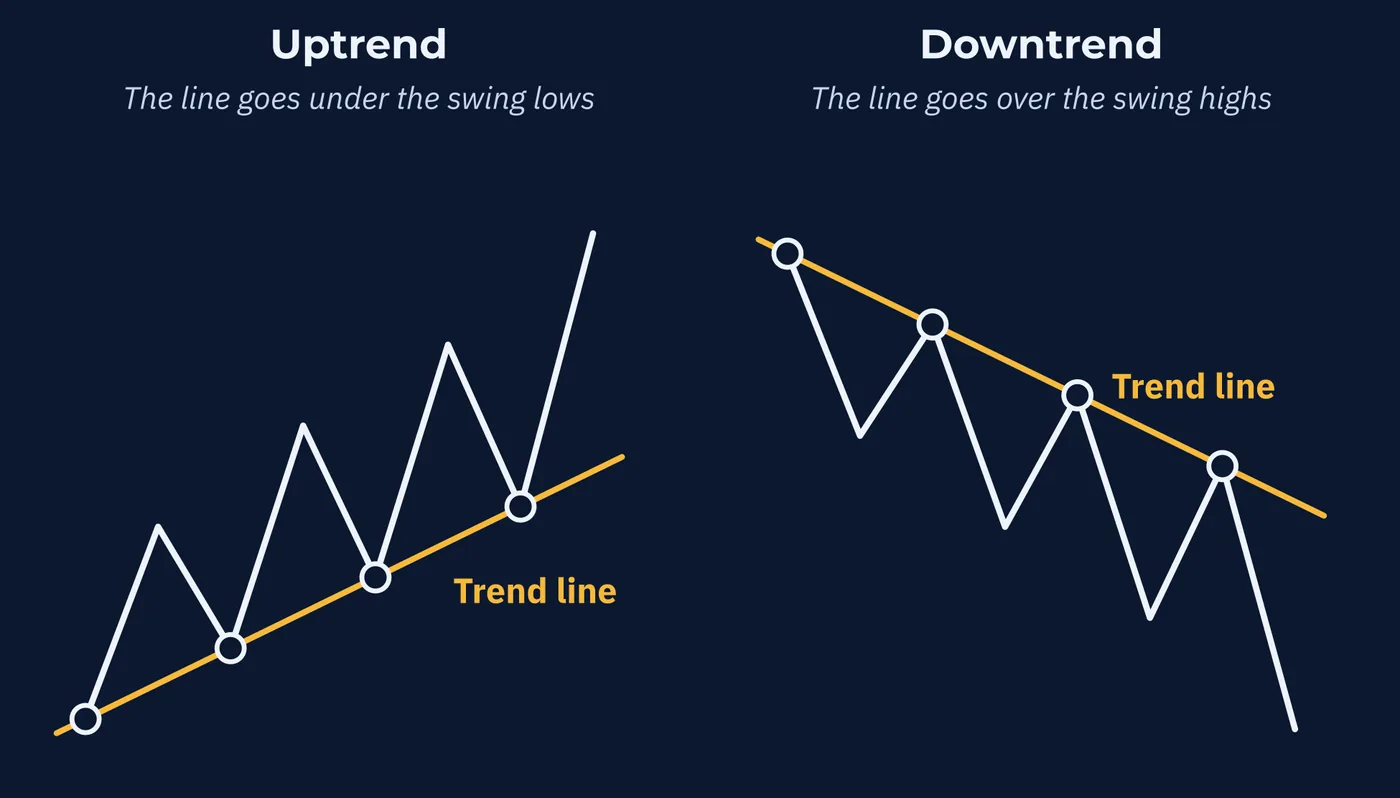
Two points are enough to draw a line. The third touch is the first real test of it.
Suppose the swings from Section 1 came one week apart, starting with the low at 1.0720 in week 0. The lows then fall in weeks 0, 2 and 4.
| Week | Swing Low | Where the Line Is | Result |
|---|---|---|---|
| 0 | 1.0720 | 1.0720 | First point |
| 2 | 1.0790 | 1.0790 | Second point |
| 4 | 1.0870 | 1.0860 | Held, 10 pips above the line |
The line through the first two lows rises 70 pips in two weeks, which is 35 pips a week. Carry it forward and it reaches 1.0860 in week 4. The third low came in at 1.0870. The line was tested and it held. Carry it on again and it reaches 1.0930 in week 6.
Now draw a second line with the same slope through the first high. The two lines together make a channel, and the upper one is called the channel line. Here it passes through 1.0860 in week 1, 1.0930 in week 3 and 1.1000 in week 5. The actual highs were 1.0860, 1.0940 and 1.1010. A channel that slopes up is an ascending channel, and one that slopes down is a descending channel.
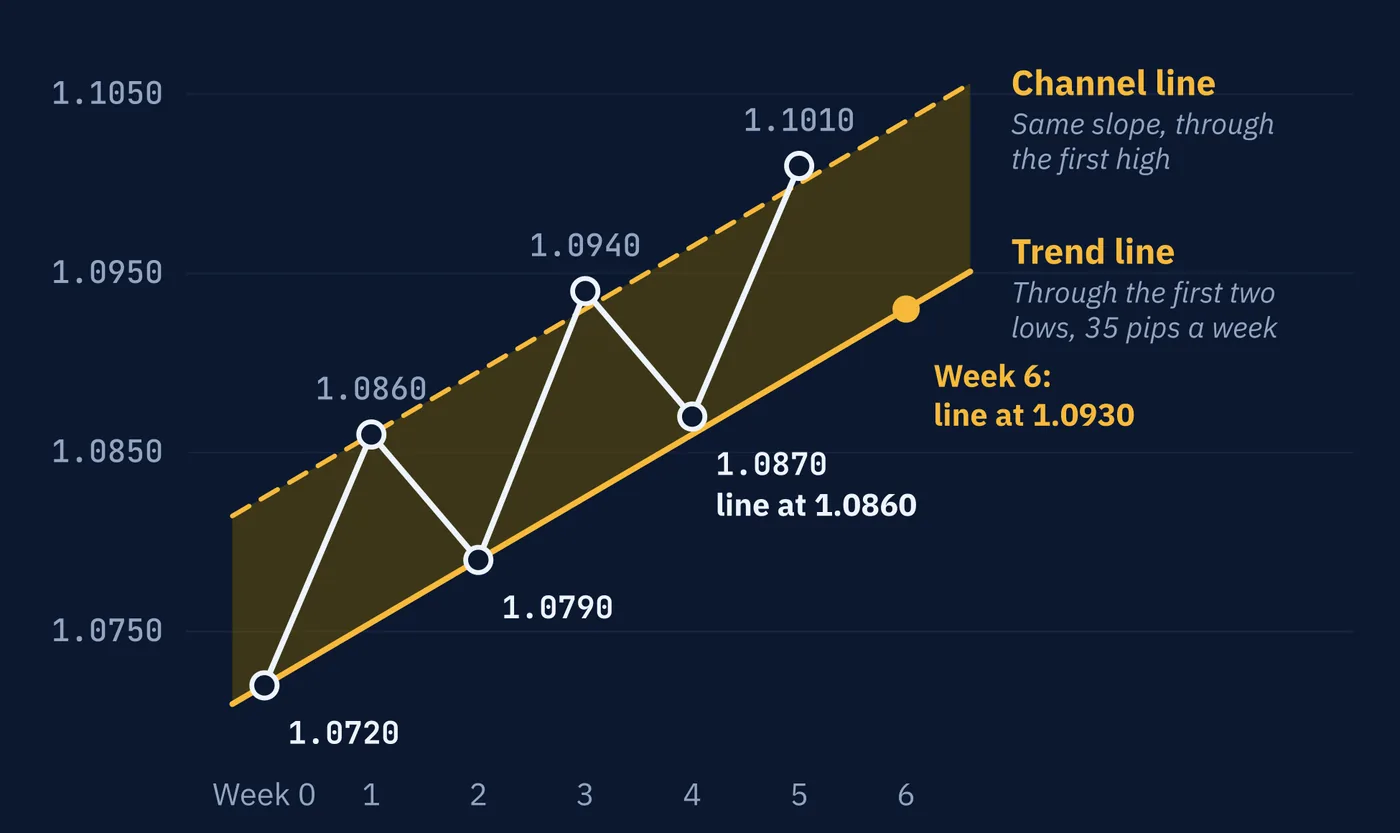
the first high.
Two cautions. First, a trend line is a drawing, not a measurement. One trader connects the wick tips, another connects the closes, a third picks different lows, and each gets a different line. The problem from Section 3 has not gone away.
Second, a break of a trend line is not the end of the trend under the definition. Price can fall through the line and still hold above its last higher low. Section 9 puts numbers on that.
8Pullback or the End?
Go back to the chart from Section 1. Price has just made a high at 1.1010 and starts to fall. A drop inside a trend that is followed by the trend continuing is called a pullback. Every uptrend is made of them. Each higher low in the table was the bottom of one.
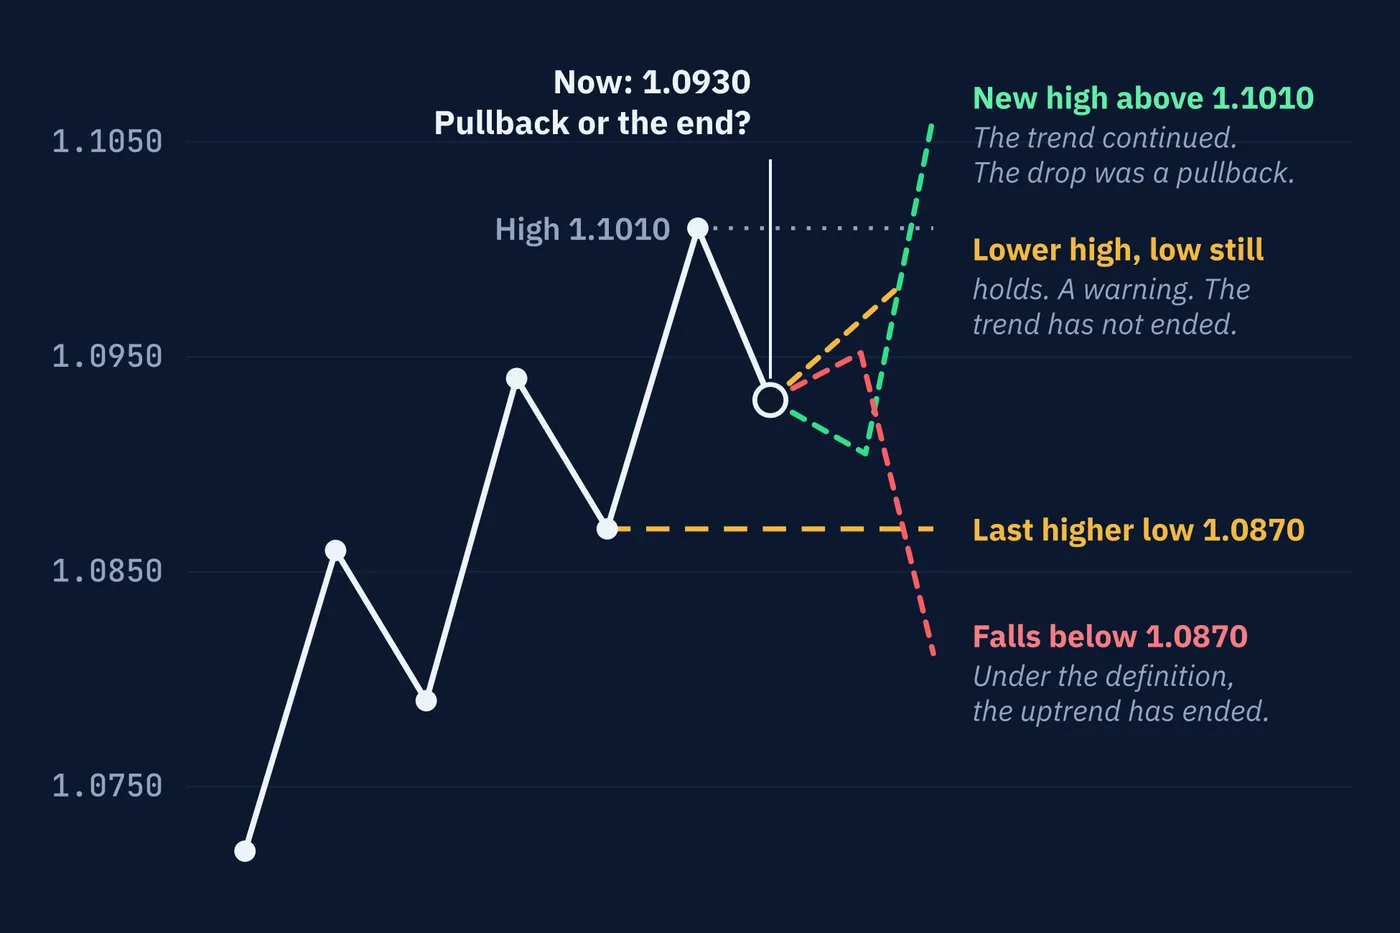
Now suppose price has fallen to 1.0930. Is this a pullback or the end of the trend?
While it is happening, nobody can tell. A pullback and the start of a reversal look the same at first. Both are price moving against the trend. The difference only shows up later, in what price does next.
The definition does give a clear answer, though, and it tells you exactly where.
| What Happens | What It Means Under the Definition |
|---|---|
| Price turns up above 1.0870 and makes a new high above 1.1010 | The trend continued. The drop was a pullback. |
| Price turns up above 1.0870 but stalls below 1.1010 | A lower high. A warning, but the trend has not ended, because the last low still holds. |
| Price falls below 1.0870 | The last higher low is broken. Under the definition, the uptrend has ended. |
The price that matters is the most recent higher low, here 1.0870. A fall below it is often called a break of structure. Some traders call the first such break against a trend a change of character. Lesson 79 covers that vocabulary.
A lower high deserves attention, but it is not the end. Plenty of trends make a weak high, pull back, and then go on to new highs. The definition waits for the low.
Everything in this section turns over for a downtrend. Here is an illustrative run of turning points on USD/JPY.
| Turning Point | Price | Compared With the Last One |
|---|---|---|
| High | 152.40 | Starting point |
| Low | 151.10 | Starting point |
| High | 151.80 | Lower high |
| Low | 150.30 | Lower low |
| High | 151.00 | Lower high |
| Low | 149.60 | Lower low |
Price is now rising from 149.60. The price that matters is the most recent lower high, 151.00. A rally that turns down below it was a correction, and the downtrend continues. A rise above it is the break of structure, and under the definition the downtrend has ended. By then price is 140 pips off the bottom.
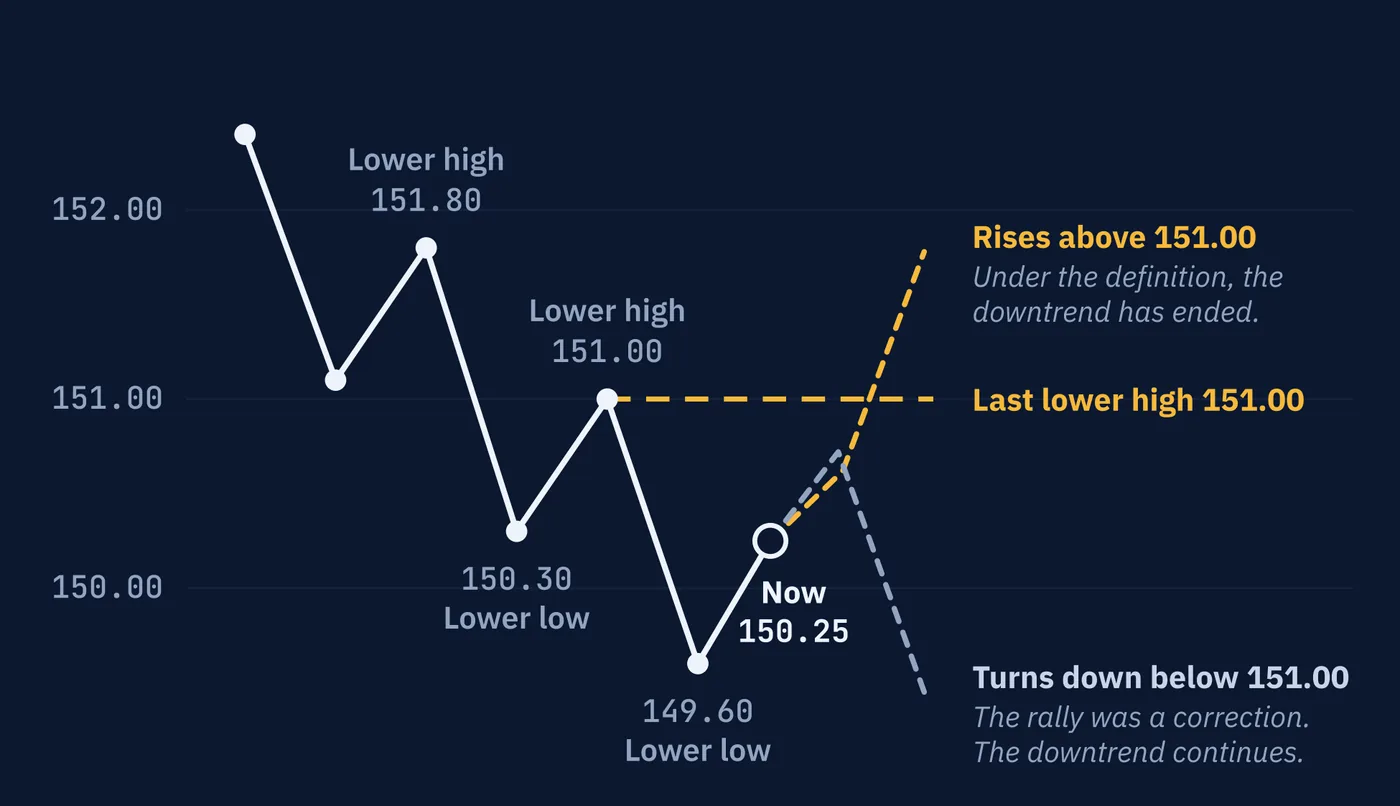
high at 151.00.
9The Price of Being Sure
Look at what waiting for the definition costs. The trend's high was 1.1010. The definition confirms the end only once price falls below 1.0870. By then price has already moved 140 pips from the top.
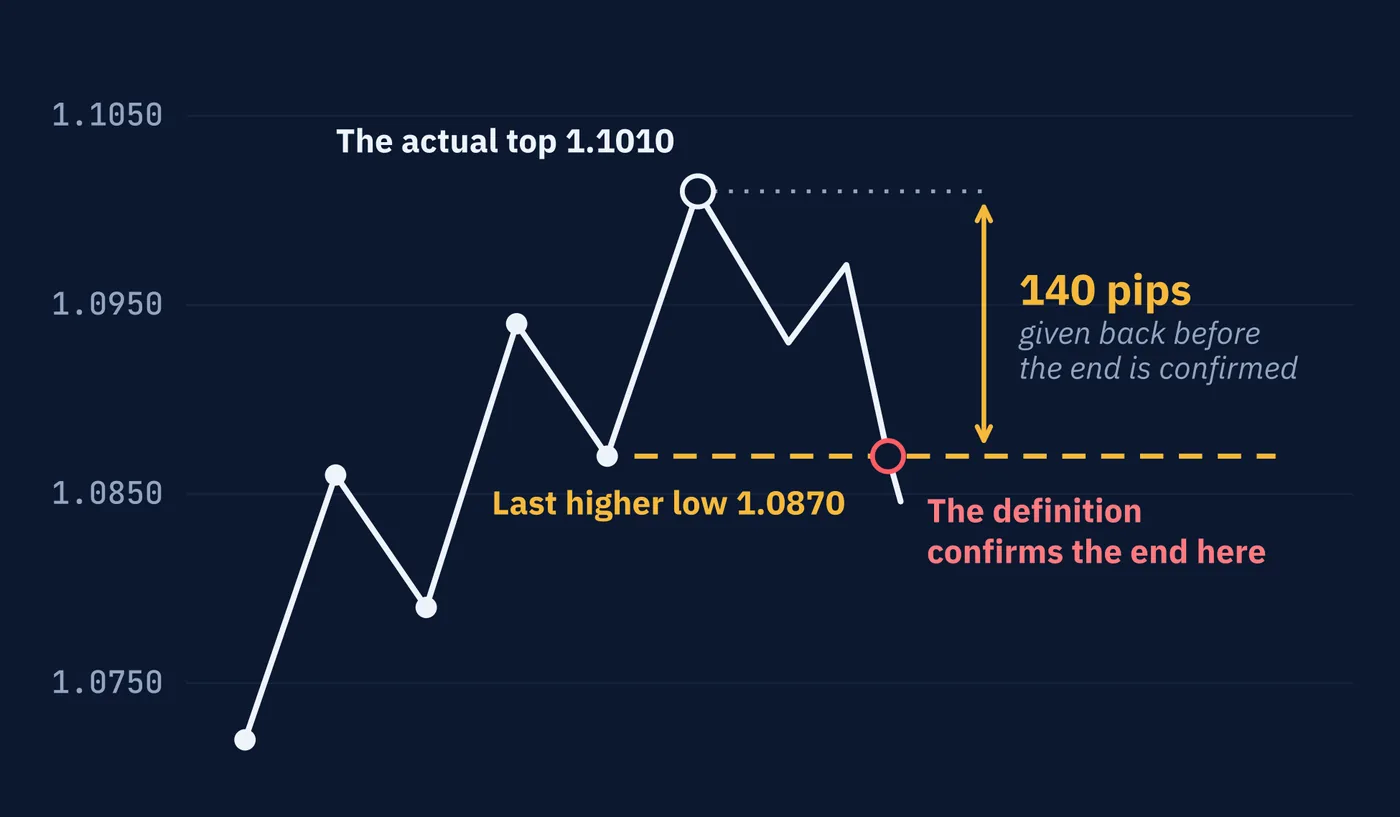
That gap is not a flaw in this particular chart. It is built into every method of spotting the end of a trend, for a simple reason. You can only confirm that something has ended after it has ended.
Every method makes a trade-off between two mistakes.
| Approach | What You Gain | What It Costs |
|---|---|---|
| React early | You give back less of the move when the trend really has ended | More false alarms, where you call an end and the trend carries on |
| Wait for confirmation | Fewer false alarms | You give back more of the move every time a trend does end |
Using smaller swings moves you toward the first row. Using larger swings moves you toward the second. The moving averages in Lesson 62 face exactly the same trade-off, just expressed as a number instead of a swing.
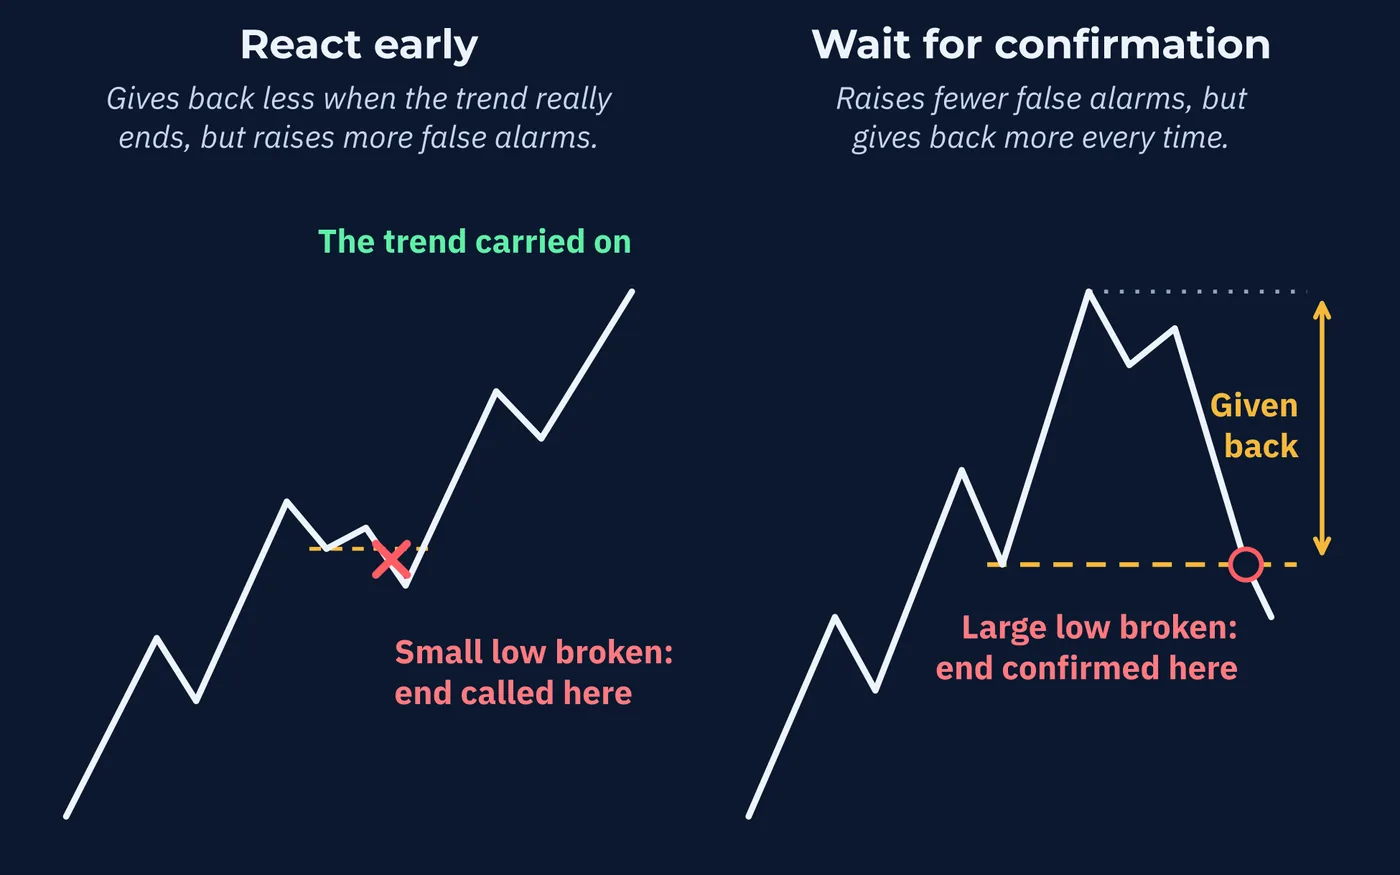
more of the move when the end is real.
The trend line from Section 7 shows the trade-off in numbers. In this example price bounces off the line once more in week 6, then falls through it at about 1.0955. That is about 55 pips below the top. The last higher low breaks later, 140 pips below the top.
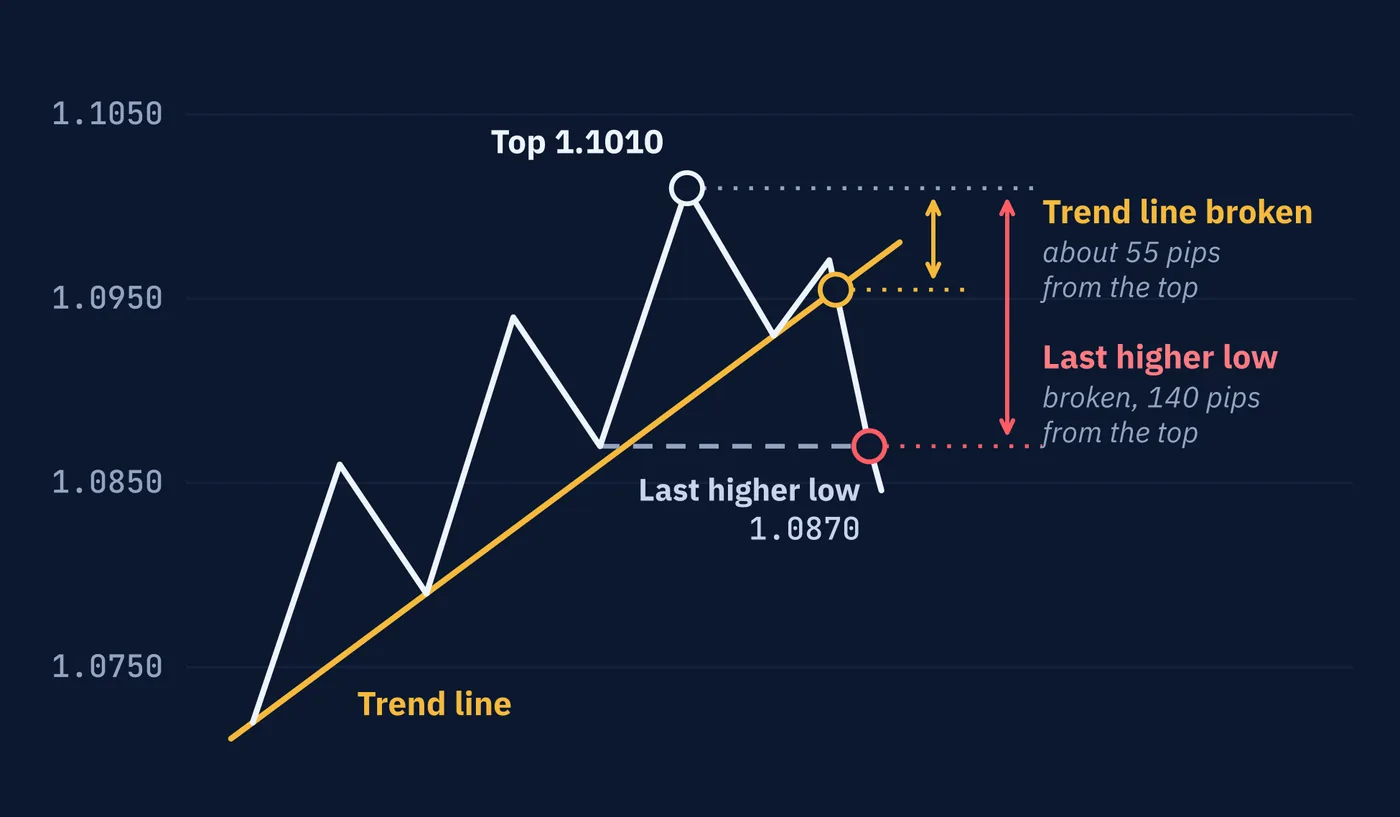
breaks 140 pips from it.
A trader who acts on the line gives back about 85 pips less. That trader also acts on every line break that turns out to be a pullback.
No setting removes the trade-off. It only chooses which mistake you make more often.
10Trends Can End Without Reversing
It is natural to picture the end of an uptrend as the start of a downtrend. Often it is not.
Price can stop making higher highs without starting to make lower lows. It falls back, recovers, falls back again, and settles between two levels. The uptrend is over, but nothing has replaced it except sideways movement.
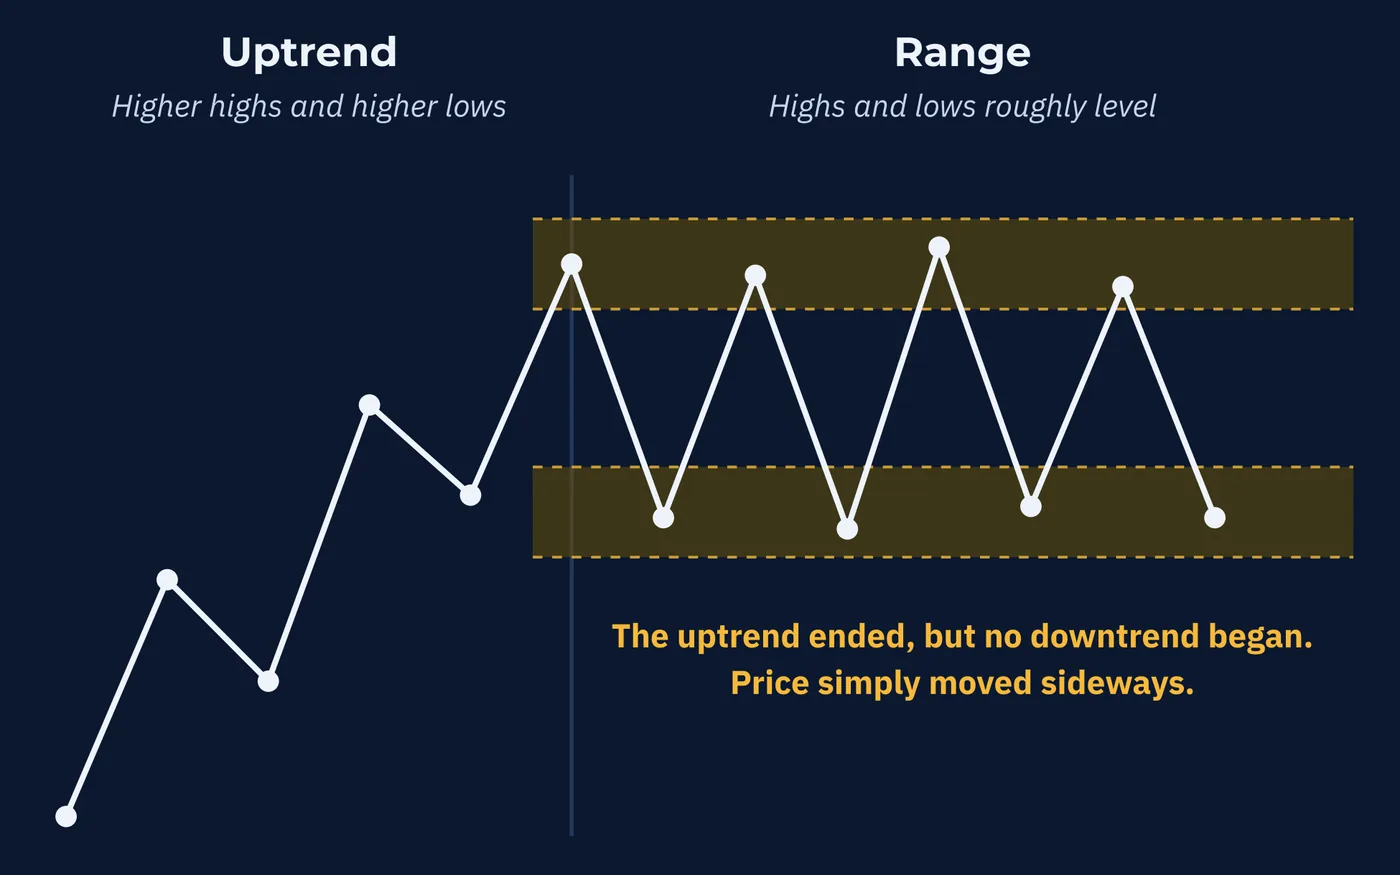
That is why the definition in Section 2 has three outcomes, not two. Up, down, and neither. A trader who expects every ended uptrend to become a downtrend will be wrong a good part of the time. Lesson 57 covers ranges, and Lesson 58 looks at how markets move between these states.
11What the Evidence Says
Are trends real, or does the eye just find patterns in noise? There is serious research on this, and the answer is more interesting than yes or no.
A widely cited 2012 study by Tobias Moskowitz, Yao Hua Ooi, and Lasse Heje Pedersen looked at 58 markets, including stock indexes, government bonds, commodities, and 12 currency pairs, from 1985 to 2009. In every one of them, a market that had risen over the past twelve months tended to keep rising for up to about a year, and one that had fallen tended to keep falling. After that, the effect partly reversed.
Two details matter for this course. First, currencies showed the weakest effect of any asset class in the study. Second, the study measured average behavior over months, across many markets. It says nothing about whether the swing on your hourly chart will continue.
Lesson 69 looks at this evidence in full. For now, the honest summary is that trends are measurably real on average, weakest in the market this course is about, and never a promise for any single chart.
Three Things to Remember
Try This
Thirty minutes with two charts of the same pair.
Words From This Lesson
| Term | What It Means |
|---|---|
| Uptrend | A series of higher highs and higher lows. |
| Downtrend | A series of lower highs and lower lows. |
| Swing high | A peak on the chart with lower prices on both sides of it. |
| Swing low | A trough on the chart with higher prices on both sides of it. |
| Pullback | A move against the trend that is followed by the trend continuing. |
| Break of structure | Price moving past the most recent swing point that defined the trend, such as the last higher low in an uptrend. |
| Dow Theory | The approach to reading price developed from Charles Dow's writing, which includes the higher-highs definition of a trend. |
| Primary, secondary and minor trend | Dow Theory's three sizes of trend: the main direction, moves against it, and day-to-day movement. |
| Leg | One move from a turning point to the next. |
| Impulse | A leg that travels with the trend. |
| Correction | A leg that travels against the trend. Also called a retracement. |
| Trend line | A straight line drawn under the swing lows of an uptrend or over the swing highs of a downtrend. |
| Channel | A trend line plus a second line with the same slope on the other side of price, called the channel line. |
Test Your Knowledge
Ten questions. Answer them all before checking the key on the following pages. If a question gives you trouble, the answer key tells you which section to revisit.
- A. Price rising quickly over a few days
- B. Price closing above the previous day's close
- C. A series of higher highs and higher lows
- D. A large green candle
- A. One of them is using the wrong chart
- B. Trends only exist on daily charts
- C. Different brokers show opposite directions
- D. They are counting different sizes of swings, often on different timeframes
- A. A secondary trend inside a primary uptrend
- B. A new primary downtrend
- C. A minor trend
- D. Proof that the uptrend is over
- A. A quarter
- B. A third
- C. Half
- D. Two-thirds
- A. 1.3180
- B. 1.3090
- C. 1.3060
- D. 1.3120
- A. Nobody can yet tell whether it is a pullback or the end
- B. It is a pullback
- C. The trend has ended
- D. A new downtrend has begun
- A. It is a warning, but the trend has not ended while the last higher low holds
- B. The trend has ended
- C. A downtrend has started
- D. Nothing at all
- A. Charts update too slowly
- B. You can only confirm something has ended after it has ended
- C. Brokers delay price data
- D. Trends always end at round numbers
- A. A downtrend always follows
- B. The pair stops trading
- C. A new uptrend always starts
- D. It may become a downtrend, but it can also settle into sideways movement
- A. Currencies showed no trends at all
- B. Currencies showed the effect, but the weakest of any asset class
- C. Currencies showed the strongest trends of any asset class
- D. Currencies were not included
Answer Key
Each answer explains why the correct choice is correct, why the others are not, and where to reread.
Question 1 · correct answer C
An uptrend is a series of higher highs and higher lows. The definition is about the sequence of turning points, not about speed or any single candle.
A describes speed, which the definition ignores. B compares single closes rather than turning points. D is one candle, and one candle cannot make a sequence.
Review: Section 2, The Definition
Question 2 · correct answer D
Which turning points count depends on the size of swing you choose to measure. Small swings on an hourly chart and large swings on a daily chart can point in opposite directions, and both readings describe something real.
A assumes one chart must be wrong, when both can be correct. C is not true; providers differ by tiny amounts, not direction. B is wrong because the definition works on any timeframe.
Review: Section 3, What Counts as a Turning Point
Question 3 · correct answer A
Dow Theory names three sizes of trend going on at once. Five months of higher highs and higher lows is the primary trend. A fall of several weeks against it is a secondary trend.
B and D treat a move against the trend as the end of it, which the definition does not do until the last higher low breaks. C is the wrong size, since a minor trend is day-to-day movement.
Review: Section 5, Three Sizes of Trend
Question 4 · correct answer C
The impulse covered 200 pips, from 1.2000 to 1.2200. The correction gave back 100 pips, from 1.2200 to 1.2100. One hundred of 200 is half.
A would be a fall of 50 pips, to 1.2150. B would be a fall of about 67 pips and D a fall of about 133 pips. Depth is always measured against the impulse before the correction.
Review: Section 6, The Legs of a Trend
Question 5 · correct answer D
The line rises 60 pips in two weeks, which is 30 pips a week. Two more weeks at the same slope add another 60 pips, so the line is at 1.3120 in week 4.
B adds only one week of rise. C leaves the line flat, which would make it a level and not a trend line. A adds four weeks of rise instead of two.
Review: Section 7, Trend Lines and Channels
Question 6 · correct answer A
While price is falling and still above the last higher low, a pullback and the start of a reversal look the same. Only what price does next tells them apart.
C and D are not yet true, because the last higher low at 1.0870 has not been broken. B assumes the trend will continue, which is not yet known either.
Review: Section 8, Pullback or the End?
Question 7 · correct answer A
A lower high is worth noticing, but under the definition the uptrend has not ended until the most recent higher low is broken. Many trends make a weak high and then continue.
B and C jump ahead of the definition. D goes too far the other way, since a lower high is a genuine warning.
Review: Section 8, Pullback or the End?
Question 8 · correct answer B
Confirmation is only possible after the fact. Any method that waits to be sure will always have given back part of the move by the time it is sure.
A and C describe technical delays that are not the reason. D invents a rule about where trends end.
Review: Section 9, The Price of Being Sure
Question 9 · correct answer D
An ended uptrend can turn into a downtrend, but it can also simply stop and move sideways between two levels. That is why the definition has three outcomes.
A and C each assume only one outcome is possible. B is not something that happens to a major pair when a trend ends.
Review: Section 10, Trends Can End Without Reversing
Question 10 · correct answer B
Every market in the study, currencies included, showed the effect, but currencies showed the weakest effect of any asset class.
A is wrong because the effect appeared in currencies too. C reverses the finding. D is wrong because 12 currency pairs were included.
Review: Section 11, What the Evidence Says
Keep going
Reading Price Structure is written by Kanin D. Alldredge for The Currency Classroom, and it is free to read. There is more free from CNS: start here.
Start free with CNS →