What a Level Actually Is

1Where Price Keeps Stopping
Open a daily chart of EUR/USD and you will often see the same thing happen more than once. Price falls, stops somewhere, and turns back up. Weeks later it falls again and stops in nearly the same place.
Here is an illustration of what that looks like.
| The Drop | Where It Stopped | What Happened Next |
|---|---|---|
| Week 2 | 1.0803 | Turned up |
| Week 5 | 1.0797 | Turned up |
| Week 8 | 1.0810 | Turned up |
Three separate drops, three turns, all within about 15 pips of 1.0800.
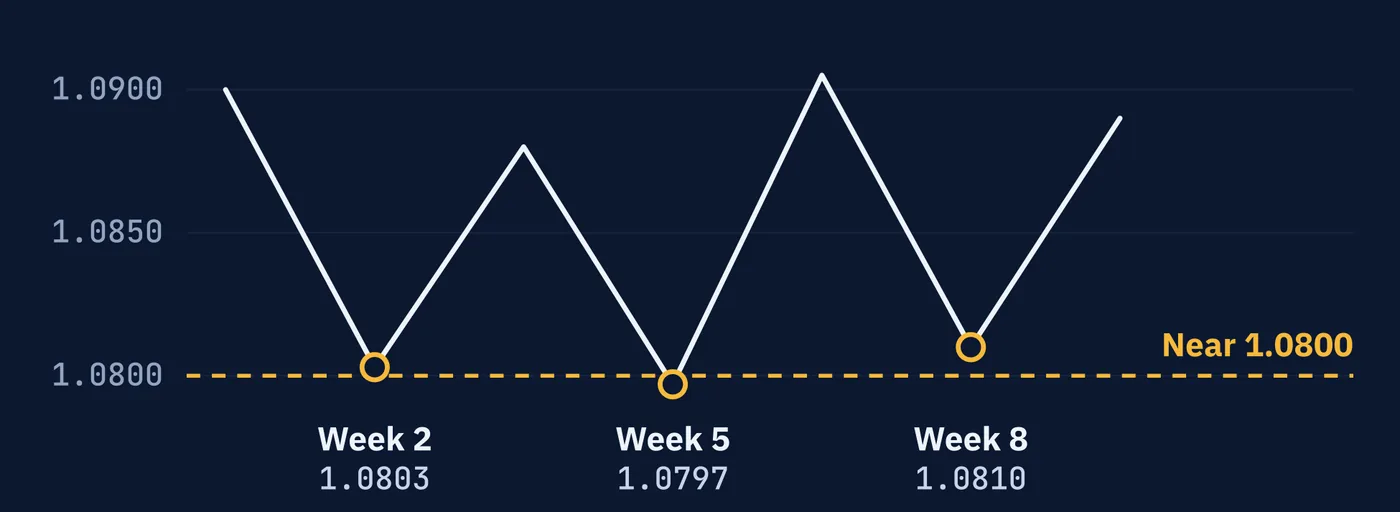
That area is what traders call a level. Nothing on the chart marks it in advance. No exchange sets it and no rule protects it. It exists because price keeps behaving as though something is there.
2Support and Resistance
A level below the current price, where falling price has stopped and turned up, is called support. A level above the current price, where rising price has stopped and turned down, is called resistance.
The names describe what happened, not what will happen. Support has supported price before. That is all the word claims.
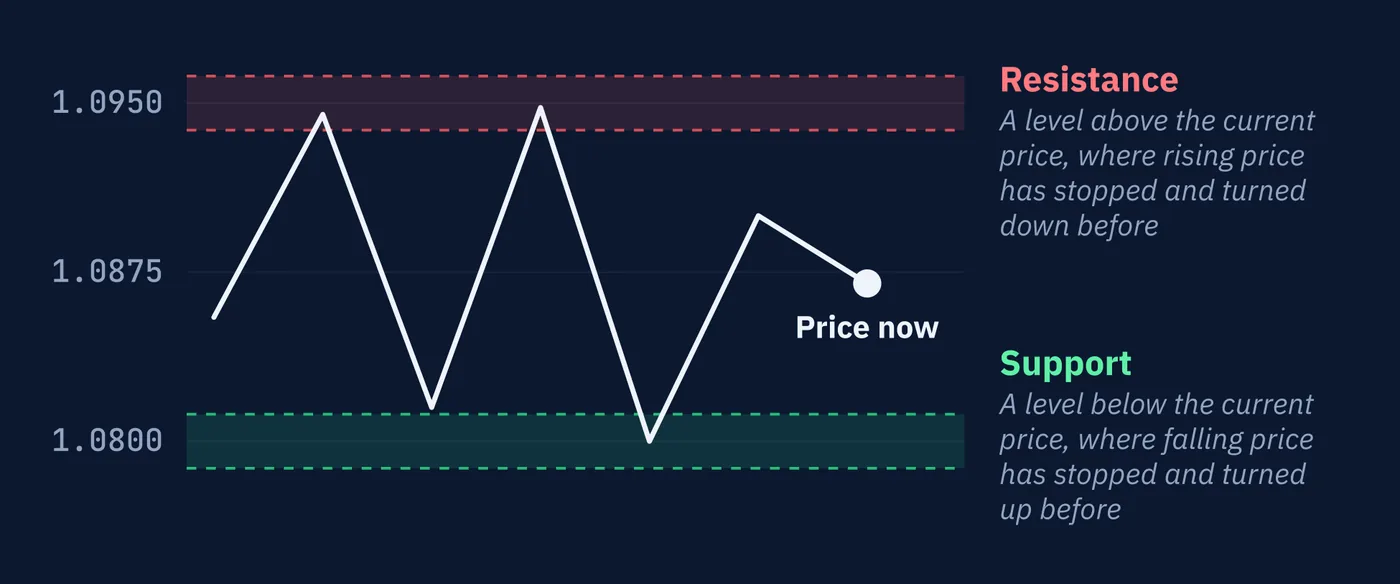
Traders also call support a floor and resistance a ceiling. Five more words describe what price does when it gets there.
| Word | What It Describes |
|---|---|
| Test | Price reaches the level. Also called a touch. |
| Hold | Price tests the level and does not get through. |
| Bounce | The move away from a level after it holds. |
| Rejection | A fast, sharp turn, often inside one candle, leaving a long wick. |
| Break | Price goes through the level and stays beyond it. |
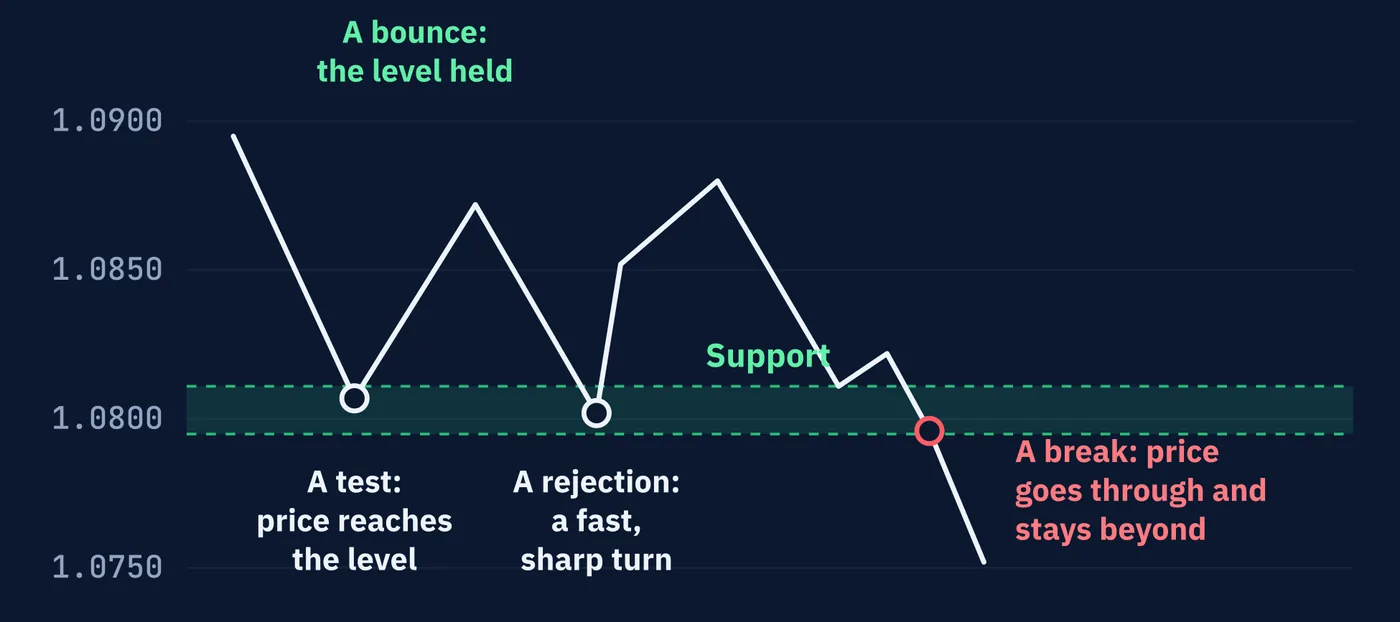
In Figure 55.3 the first drop is a test, the level holds, and the rise that follows is a bounce.
Traders usually draw them as horizontal lines across the chart. Section 6 explains why a band is more honest than a line, and Section 10 explains how the same price can be support at one time and resistance at another.
3Why Orders Gather There
Lesson 54 mentioned a study of real orders. It is one of the few direct pieces of evidence on why levels exist at all, so the details matter.
An economist at the Federal Reserve Bank of New York, Carol Osler, examined the orders that clients had left with a large currency dealing bank. Not trades already done, but instructions waiting to be filled. Take my profit at this price. Close my position if price reaches that one.
Those waiting orders were not spread evenly across prices. They were heavily bunched at round numbers, prices ending in 00 or 50 such as 1.0800 or 1.0850. And the two kinds of order bunched in different places.
| Order Type | Where It Bunched | What It Does When Price Arrives |
|---|---|---|
| Take-profit | At the round number itself | Works against the move, because it closes positions that are in profit |
| Stop-loss | Just past the round number | Pushes the move further, because it closes losing positions in the direction price is already going |
So a price falling toward 1.0800 meets profit-taking at 1.0800 that tends to slow it down, and a cluster of stops just below that can speed it up if it gets through.
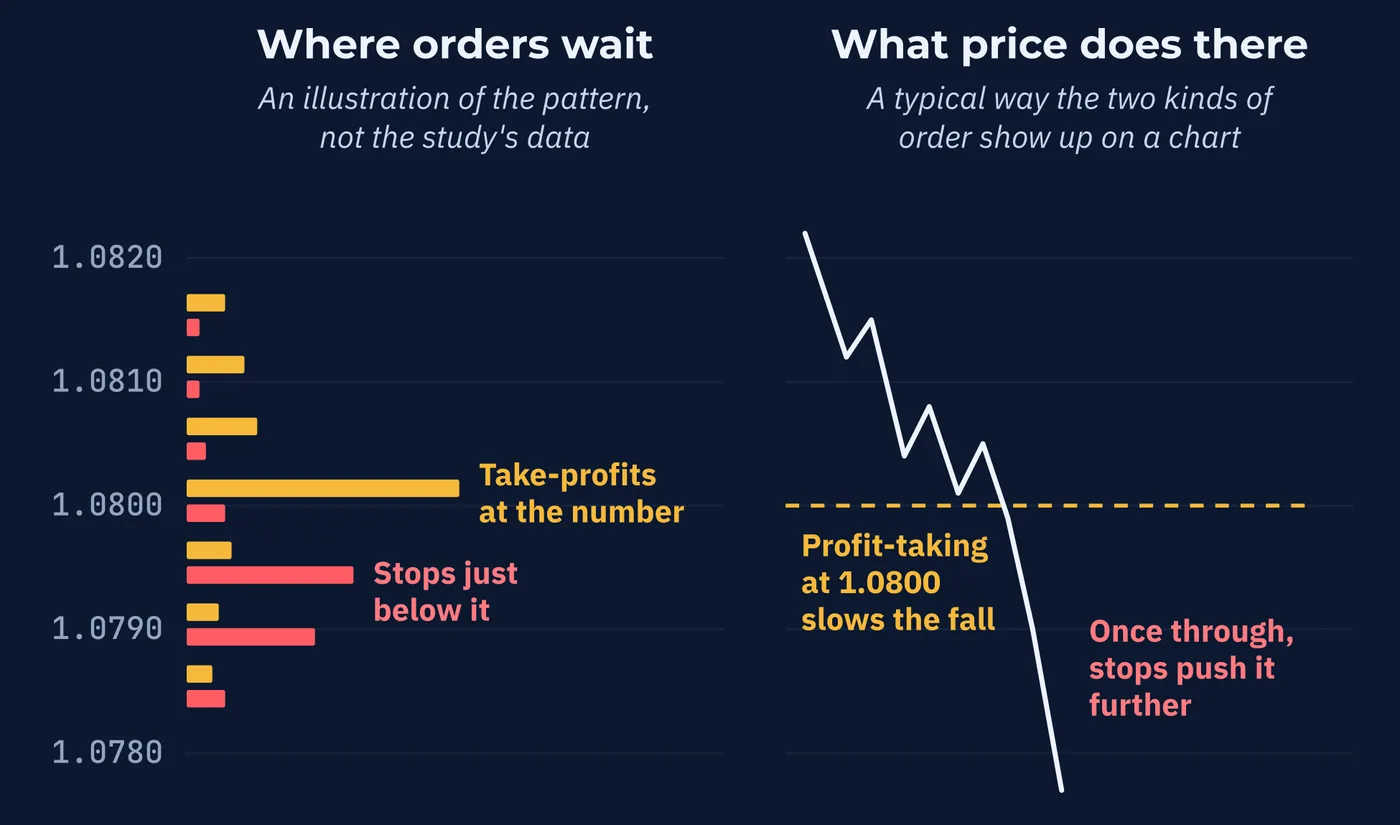
data.
That one arrangement explains two things traders see constantly. Price stalls at round numbers, and price often runs hard once it breaks through one. Lesson 43 described stops as counterparties for large participants. This is where they tend to sit.
4Memory and the Breakeven Exit
Orders explain part of it. People explain the rest.
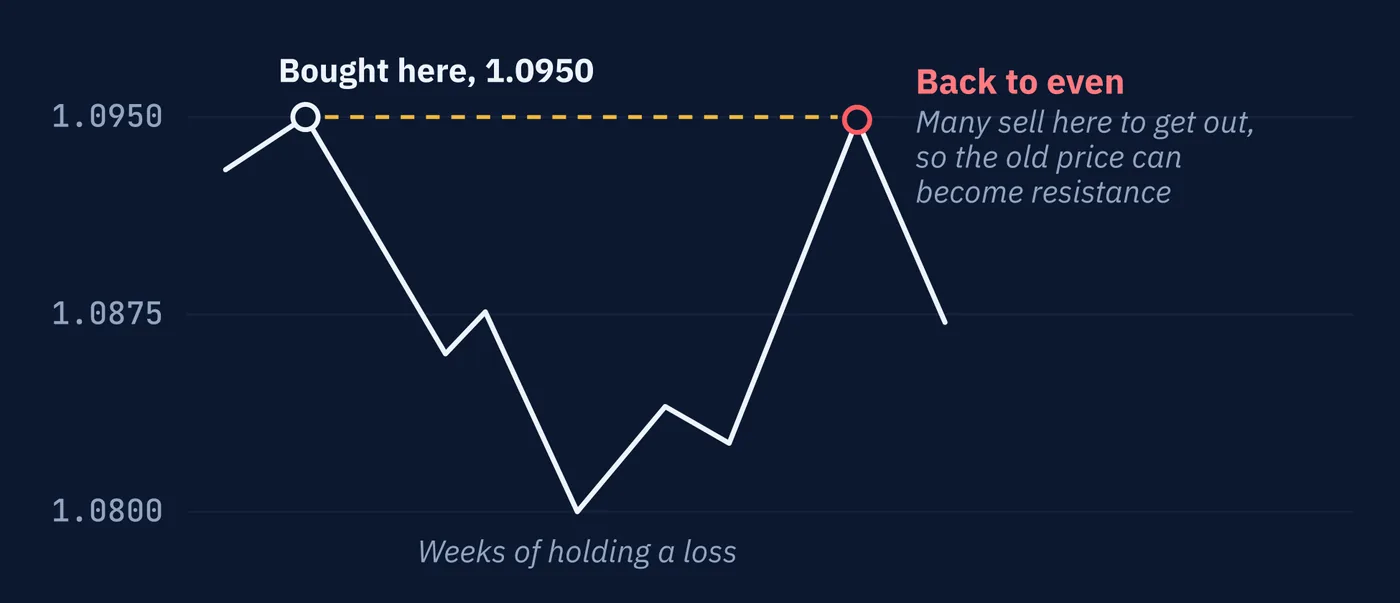
Think about a trader who bought at 1.0950, just before price dropped to 1.0800. For weeks they have held a loss. When price finally climbs back to 1.0950, many traders in that position have the same thought: get me out at even.
Their selling arrives at the price where they bought, which is one reason an old turning point often becomes resistance later.
even.
The habit behind it is well documented. Researchers studying individual investors have found again and again that people sell winning positions more readily than losing ones, and hold losers hoping to get back to even. It is called the disposition effect.
What nobody has measured is how much of any particular currency level that habit accounts for. It is a reasonable explanation that fits what charts show. Treat it as an explanation, not as a measured fact.
A third force is simpler still. Many people look at the same chart and see the same obvious level. Some place orders there partly because they expect others to. That is why obvious levels tend to behave more like levels than subtle ones.
5The Kinds of Level You Will Meet
Sections 3 and 4 explained why levels form. In practice they turn up in a few standard places, and each kind has a name.
| Kind of Level | What It Is | Where to Find It |
|---|---|---|
| Swing high and swing low | A peak where a rise ran out, or a trough where a fall ran out | The turning points on any chart |
| Previous-period high and low | The high and low of the last finished day, week, month or year | The last finished daily, weekly or monthly candle |
| Round number | A price ending in 00 or 50. Also called a psychological level | The price scale |
| Session high and low | The high and low of one trading session, such as the Asian session (Lesson 22) | An hourly chart or shorter |
You will see the previous day's high and low written as PDH and PDL. These levels need no drawing. Anyone can read them off the last finished candle.
Say EUR/USD is trading at 1.0880 on a Tuesday afternoon. Figure 55.6 marks five levels around it on an illustrative chart.
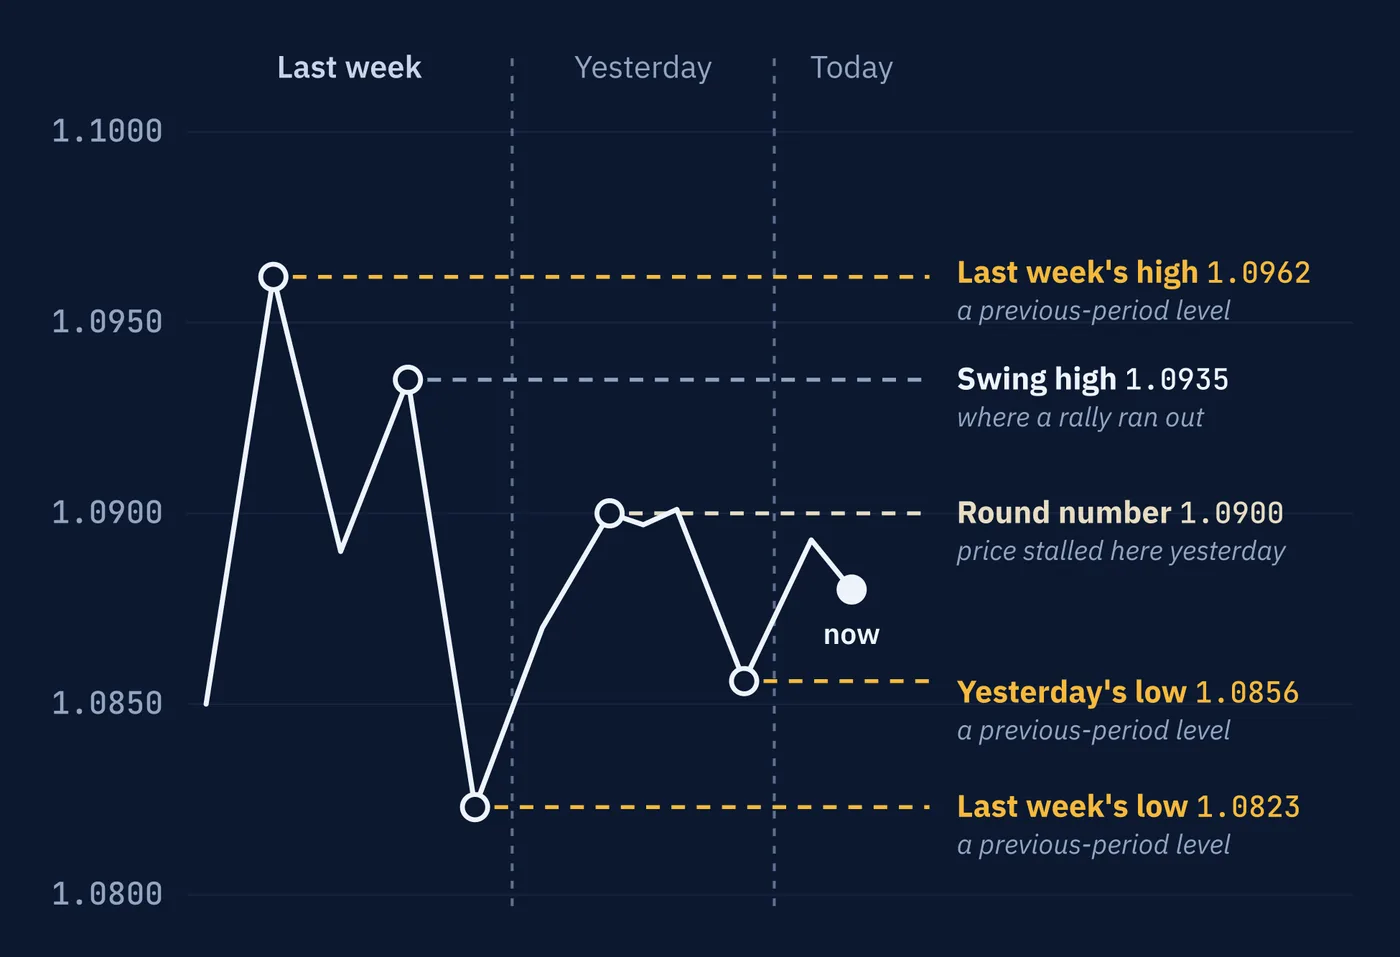
The nearest one above price is the round number at 1.0900, 20 pips away. The nearest one below is yesterday's low at 1.0856, 24 pips away. Those two are where the next decision is most likely to be made.
Other levels come from tools, and later lessons cover them: trend lines (Lesson 56), moving averages (Lesson 62), Fibonacci retracements and pivot points (Lesson 66), and supply and demand zones (Lesson 79). This lesson stays with horizontal levels read straight from price.
6A Zone, Not a Line
Look again at the three stopping points from Section 1: 1.0803, 1.0797, 1.0810. None of them is exactly 1.0800, and no two are the same.
That is normal, and there are three reasons for it.
The orders are spread out. Take-profits sit at the round number and stops sit just past it, so price can be expected to poke slightly through before it turns, or not to quite reach it.
Your chart is not the only chart. Lesson 40 showed that there is no official price, so different providers show slightly different numbers. And as Lesson 14 explained, most charts draw only the bid, so the price at which someone could actually buy was higher by the spread.
Traders do not all choose the same price. Some aim for the number, some for just in front of it, and some for wherever the last turn happened.
So mark a level as a band rather than a single price. Here, 1.0795 to 1.0810 describes what happened. A single line at 1.0800 does not.
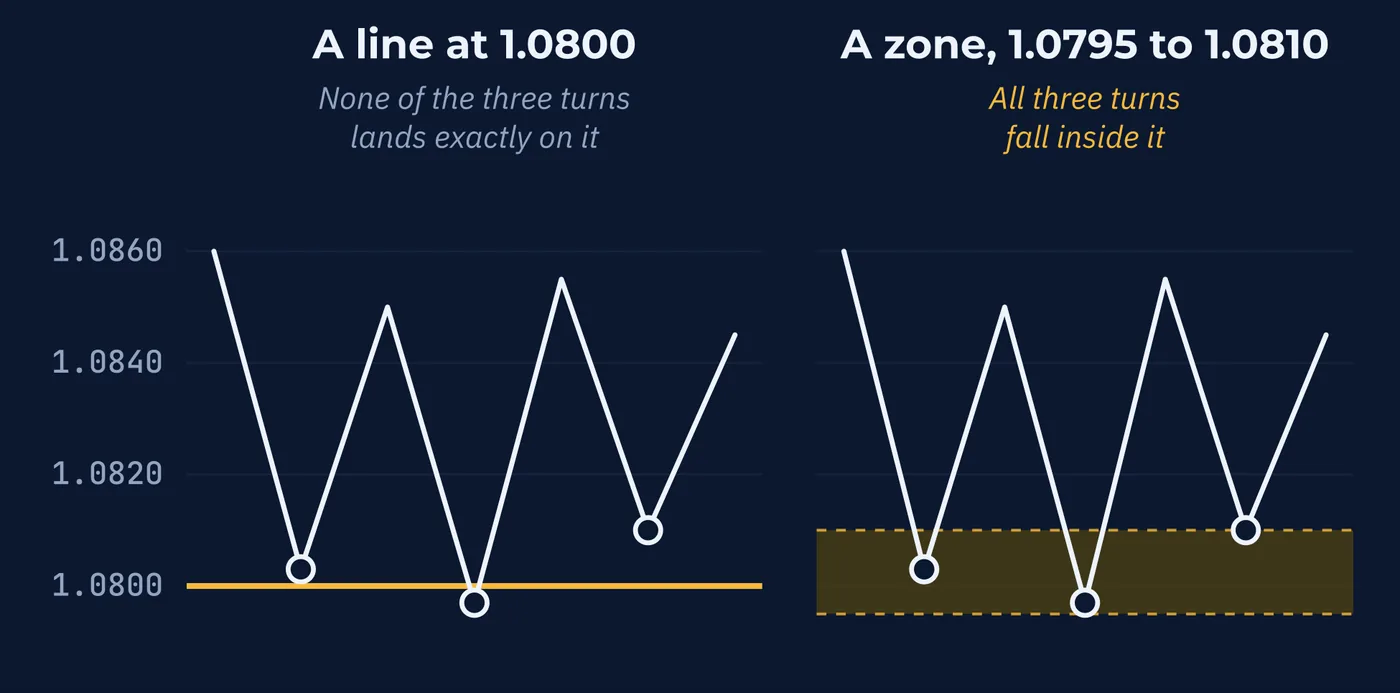
three.
A line suggests a precision the market never promised.
7How to Mark a Level
Here is one common way to mark a level on your own chart, in five steps.
Step 1. Start on the daily chart. Zoom out until you can see six months to a year. A level that shows at this distance is one that most traders can see.
Step 2. Find the turns. Look for an area where price turned at least twice, or turned once and then moved a long way. Start with swing highs and lows, then check last week's high and low and the nearest round numbers.
Step 3. Draw the zone. At each turn, take the candle that reached furthest and note two prices: the tip of its wick and its close. For resistance, the top of the zone is the highest wick tip and the bottom is the lowest of those closes. For support, turn it over: the bottom is the lowest wick tip and the top is the highest of the closes.
Step 4. Check what else is there. A round number inside the zone, or a previous week's high or low, gives more traders a reason to watch it.
Step 5. Record it before price arrives. Record the zone, the date you marked it, and what kind of level it is. Section 12 explains why the date matters.
Say USD/JPY has turned down three times this year from just under 150.00. Here are the three turn candles on an illustrative daily chart.
| Turn | Wick Tip | Close |
|---|---|---|
| March | 149.62 | 149.41 |
| April | 149.55 | 149.38 |
| June | 149.68 | 149.47 |
The highest wick tip is 149.68. The lowest of the three closes is 149.38. So the zone runs from 149.38 to 149.68, which is 30 pips wide.
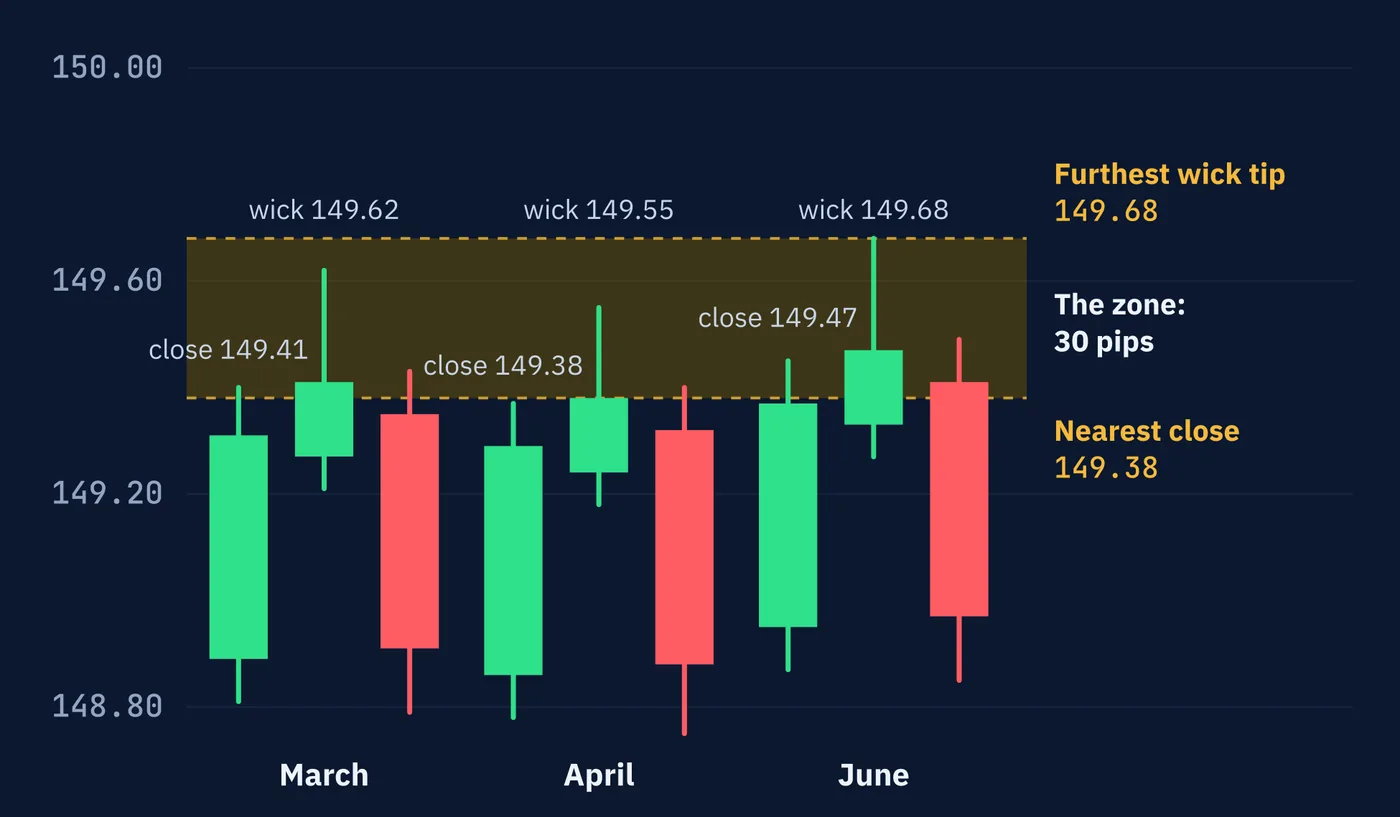
is the lowest of the three closes.
Nobody needs a zone marked to the pip, so call it 149.40 to 149.70. Step 4 finds a round number, 149.50, inside it.
The wick shows how far price was pushed before it was turned back. The close shows where price settled once the day was over. The turning took place between them.
How wide should a zone be? There is no rule, but there is a sanity check. Compare the zone with how far the pair usually moves in a day, which Lesson 65 shows how to measure. A zone as wide as a full day's movement tells you almost nothing. If the turns are too scattered to give a tight zone, there is no clear level there.
How many levels should a chart have? Fewer than you think. The levels that matter are the nearest clear one above price and the nearest clear one below. A chart with fifteen lines has a line near every price, and then the lines tell you nothing.
8Major and Minor Levels
Traders sort levels into major levels, also called key levels, and minor levels. Nothing official separates the two, but four questions do the sorting.
| Question | Points Toward Major | Points Toward Minor |
|---|---|---|
| Which chart shows it? | The daily or the weekly | Only a 15-minute or hourly chart |
| How far apart are the turns? | Weeks or months | Minutes or hours |
| How did price leave? | A long way, quickly | A few pips, slowly |
| What else sits there? | A round number, or a previous week's or month's high or low | Nothing |
The idea behind all four is the one from Section 4. The more traders who can see a level, the more orders are likely to be waiting there.
Take the level from Section 1. It shows on a daily chart. Its three turns were three weeks apart. Each was followed by a rise of roughly 80 to 110 pips. And it sits on a round number, 1.0800. All four answers point to major.
Now picture 1.0872 on a 15-minute chart of the same pair, where price paused twice in one afternoon, an hour apart, and left by a few pips. Nothing else is there. That is a minor level.
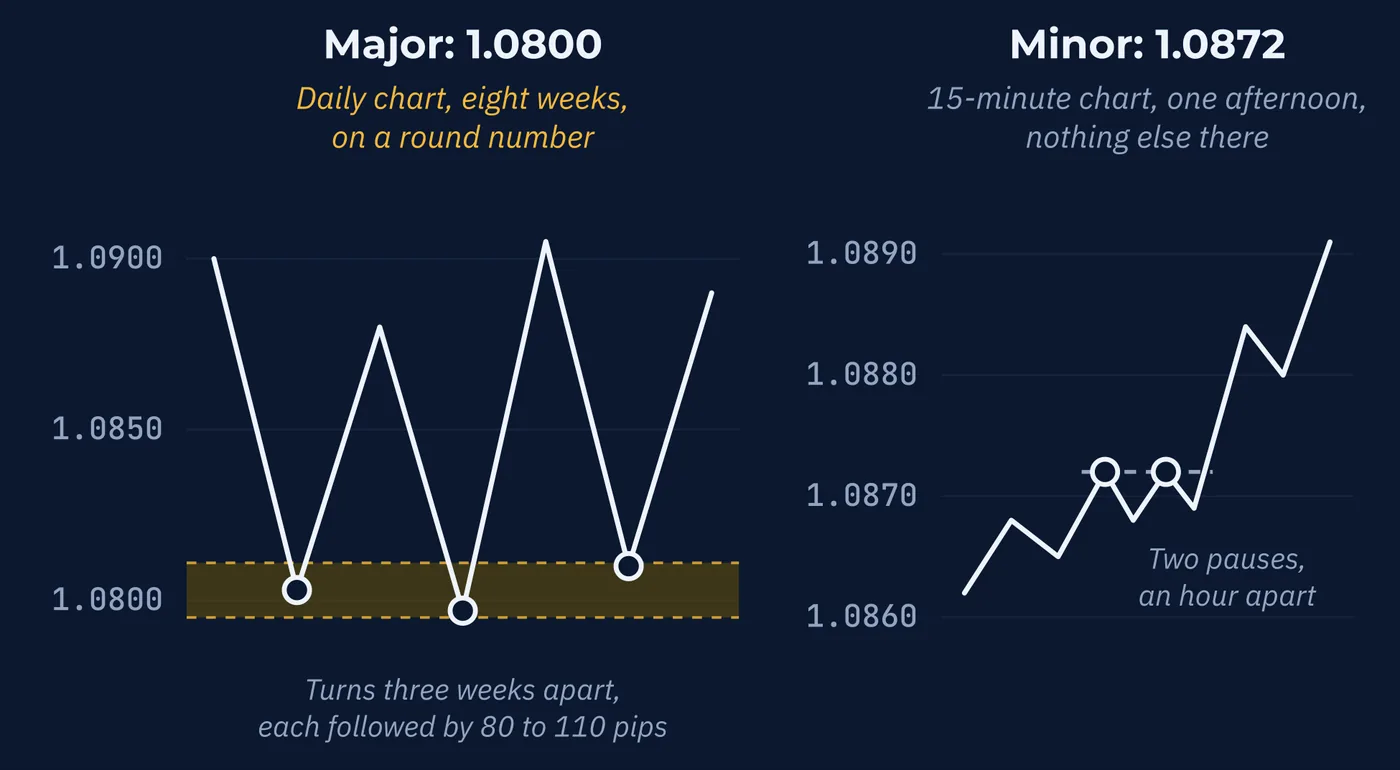
A minor level matters for an afternoon. A major level can matter for months.
Major means widely watched. It does not mean the level will hold. Major levels break too, as parity did in 2022.
9What Counts as a Break
Section 2 said a break is price going through a level and staying beyond it. Staying needs a definition, or two traders will disagree about the same chart. There are two common conventions.
Any trade beyond the zone. The moment price trades past the far edge, the level has broken. This is the quickest test. It also counts every brief poke through.
A close beyond the zone. The level has broken only when a candle closes past the far edge. Traders who use this say which candle they mean, usually the daily or the four-hour.
Take the USD/JPY zone from Section 7, 149.40 to 149.70, and two illustrative days.
| Day | High | Close | Traded Beyond? | Closed Beyond? |
|---|---|---|---|---|
| Tuesday | 149.81 | 149.36 | Yes | No |
| Thursday | 149.95 | 149.88 | Yes | Yes |
On Tuesday price traded 11 pips above the zone, then closed below it. By the first convention the level broke. By the second it did not, and the candle shows a rejection: a long wick through the zone and a close back under it. On Thursday both conventions agree.
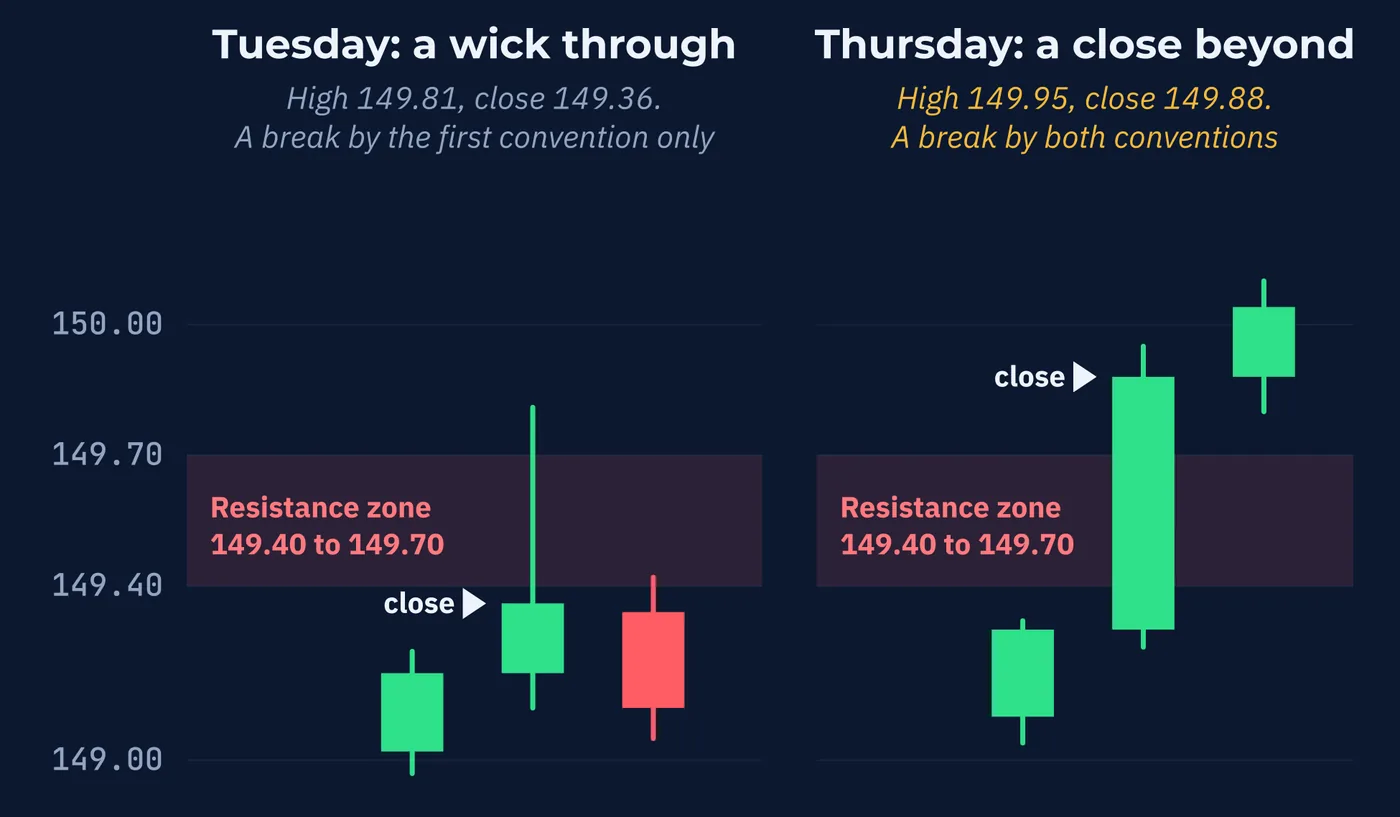
below. Thursday's closes beyond it.
A break that does not last is called a false break, or a fakeout. Lesson 57 looks at false breaks from a range.
Neither convention is the right one. Waiting for the close filters out the pokes, but by Thursday's close price was already 18 pips beyond the zone, and a close beyond can still fail the next day. Choose one convention and use it every time, so your records mean the same thing from week to week.
10When a Level Breaks, It Can Switch Sides
Levels do break. When they do, something worth knowing often happens next.
Say resistance sits at 1.0950. Price finally pushes through, climbs to 1.1050, then drifts back down toward 1.0950. And this time it turns up from there. The old ceiling is acting as a floor.
That switch is called role reversal, and the return visit to the broken level is called a retest. Traders also say the level has flipped.
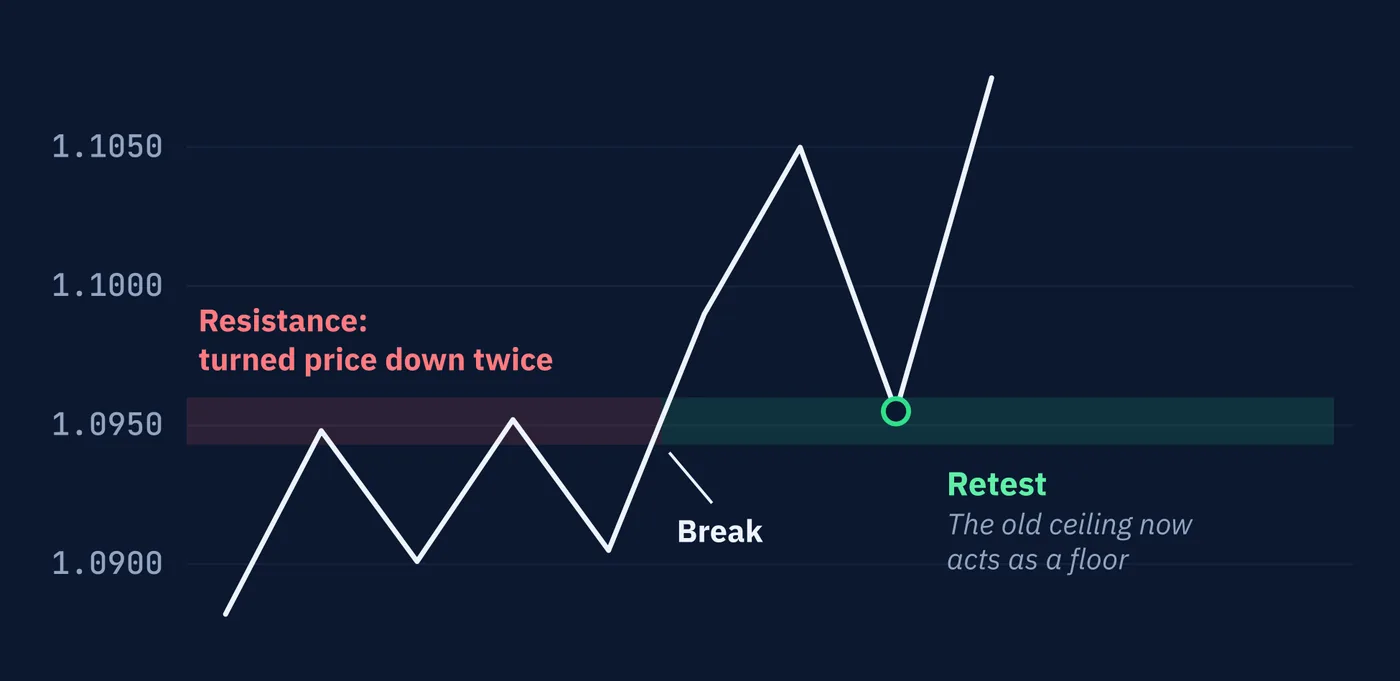
The same forces from Sections 3 and 4 explain it. Traders who sold at 1.0950 expecting the ceiling to hold are now losing. If price comes back, some buy there to get out near even. Traders who watched the break and missed it see the return as a second chance.
Often is not always. A retest that fails, with price falling straight back through, is common too. Lesson 71 looks at breakouts and false breaks in full.
11Stronger or Weaker With Each Test?
Ask traders whether a level that has held four times is stronger than one that has held twice, and many will say yes. More tests, more people watching, more orders waiting.
There is a respectable argument the other way. Each test fills some of the orders sitting at the level. The take-profits that stopped price last time have been used. A level that gets hit again and again may be running out of the very thing that held it.
Both arguments make sense. Neither is settled for levels in general. What you can say is that the number of touches alone does not tell you which way the next one goes.
12What a Level Tells You, and What It Does Not
Put it together. A level is an area where waiting orders are likely bunched, where some traders have a reason to act, and where many others are watching. That makes it a place where something is likely to happen.
It does not tell you what.
A level tells you where the decision happens. It does not tell you how the decision goes.
Price can stop there, or break through and run, and the same orders support both outcomes. That is not a flaw in the idea. It is what Lesson 54 meant when it said technical analysis answers where and when, but not whether.
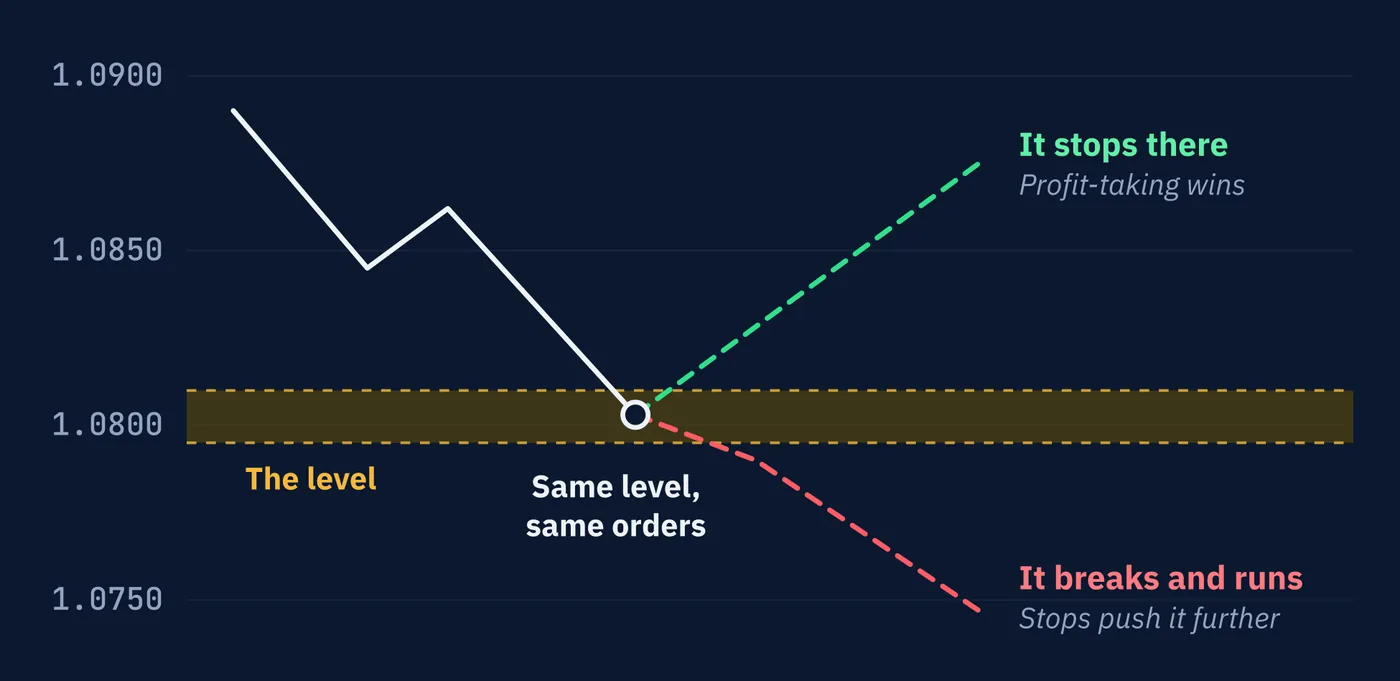
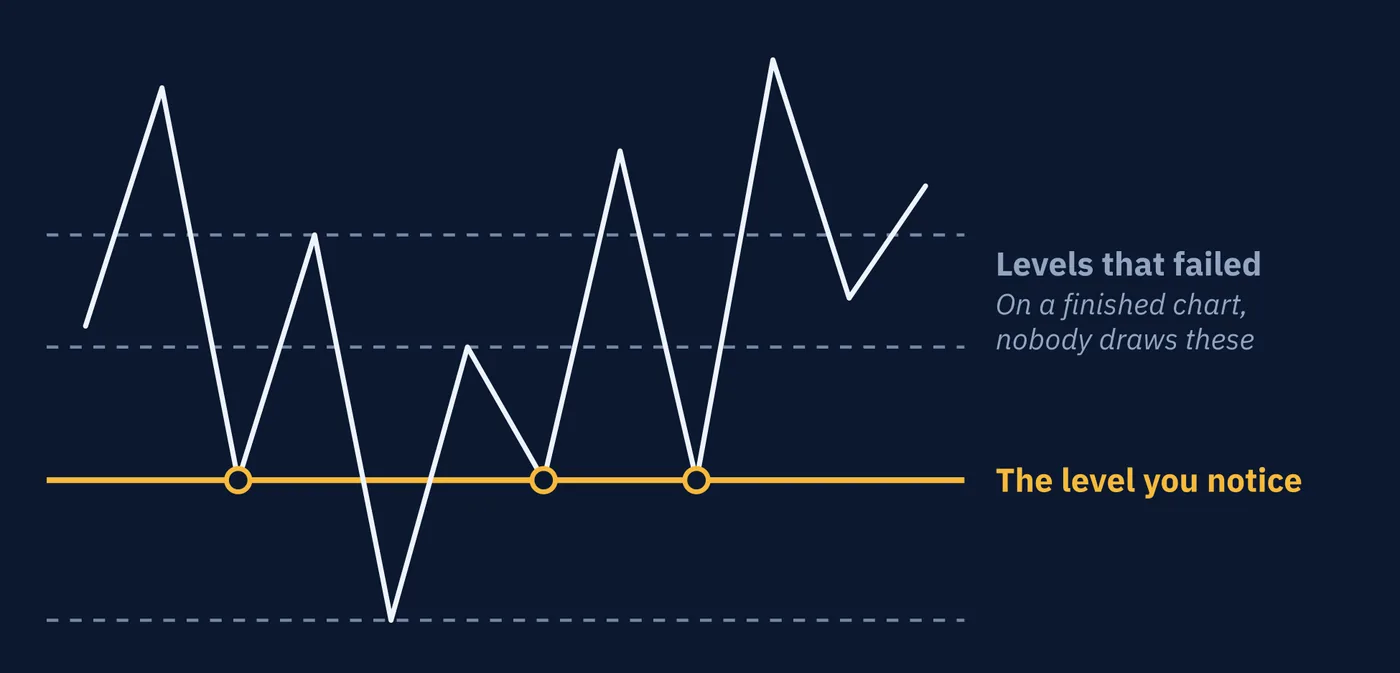
to miss.
Levels describe where price has stopped. The next lesson looks at what price does between them, and at how to tell when a trend has ended.
Three Things to Remember
Try This
Thirty minutes, and you will need to cover part of your screen.
Words From This Lesson
| Term | What It Means |
|---|---|
| Level | An area on a chart where price has stopped and turned before. |
| Support | An area below the current price where falling price has stopped and turned up before. |
| Resistance | An area above the current price where rising price has stopped and turned down before. |
| Test | Price reaching a level. Also called a touch. |
| Bounce | The move away from a level after it holds. |
| Rejection | A fast, sharp turn at a level, leaving a long wick. |
| Break | Price going through a level and staying beyond it. |
| False break | A break that does not last. Also called a fakeout. |
| Round number | A price ending in 00 or 50, such as 1.0800 or 1.0850, where waiting orders tend to bunch. Also called a psychological level. |
| Take-profit order | An instruction to close a position automatically once it reaches a set profit. |
| Disposition effect | The documented habit of selling winners readily while holding losers in hope of breaking even. |
| Swing high, swing low | A peak where a rise ran out, or a trough where a fall ran out. |
| Previous-period level | The high or low of the last finished day, week, month or year. |
| Zone | A level marked as a band, with a top and a bottom. |
| Major level | A widely watched level, visible on a daily or weekly chart. Also called a key level. |
| Minor level | A level visible only on short timeframes. |
| Role reversal | A broken level acting the opposite way, such as old resistance holding as support. Also called a flip. |
| Retest | A return to a level after price has broken through it. |
Test Your Knowledge
Ten questions. Answer them all before checking the key on the following pages. If a question gives you trouble, the answer key tells you which section to revisit.
- A. Price will stop there the next time it arrives
- B. A central bank has promised to defend that price
- C. Falling price has stopped and turned up there before
- D. An exchange has set a floor at that price
- A. Evenly across all prices
- B. Just past round numbers
- C. At round numbers themselves
- D. At the previous day's closing price
- A. Sell to get out at even, which adds selling at that price
- B. Add to the position
- C. Move their stop further away
- D. Nothing, because the loss has disappeared
- A. Last week's high
- B. A peak where a rally ran out
- C. A price ending in 00
- D. A trend line
- A. Zones are easier to see on small screens
- B. Lines only work on hourly charts
- C. Regulators require levels to be shown as zones
- D. Orders sit around the number, providers quote slightly different prices, and traders choose different prices
- A. 1.2748 to 1.2755
- B. 1.2731 to 1.2755
- C. 1.2731 to 1.2738
- D. 1.2738 to 1.2748
- A. It shows on a daily chart, with turns weeks apart and a round number inside it
- B. It shows only on a 5-minute chart
- C. It was the most recent level drawn
- D. Price paused there twice in one afternoon
- A. The level broke, because price traded above the zone
- B. Role reversal
- C. No break, because the candle closed back below the zone
- D. A retest
- A. A false break
- B. Proof that the trend has ended
- C. A gap
- D. A retest, with the old resistance acting as support
- A. Older price data is more accurate
- B. You already know where price turned, so the levels that failed never get drawn
- C. Charting tools smooth out older prices
- D. Markets were more orderly in the past
Answer Key
Each answer explains why the correct choice is correct, why the others are not, and where to reread.
Question 1 · correct answer C
Support describes what happened. Falling price stopped and turned up in that area before. The word makes no claim about what happens next time.
A turns a record into a prediction, which is exactly what the name does not mean. B describes a peg, covered in Series F, not a chart level. D is wrong because this market has no exchange to set anything.
Review: Section 2, Support and Resistance
Question 2 · correct answer C
Take-profit orders bunched at the round numbers themselves. Stop-loss orders bunched just past them, which is the difference that explains how levels behave.
B describes where the stop-loss orders sat, not the take-profits. A is the opposite of the finding, since the orders were heavily bunched. D is not something the study reported.
Review: Section 3, Why Orders Gather There
Question 3 · correct answer A
After weeks of holding a loss, many traders want out at even. Their selling arrives at the price where they bought, which is one reason old turning points become resistance.
B is the opposite of the documented habit. C is a possible action but not the one the lesson describes. D is wrong because the loss disappearing is precisely the moment many choose to sell.
Review: Section 4, Memory and the Breakeven Exit
Question 4 · correct answer A
A previous-period level is the high or low of the last finished day, week, month or year. Last week's high is one, and it can be read straight off the weekly candle.
C describes a round number and B a swing high. Both are kinds of level, but neither is the high or low of a finished period. D names a level that comes from a tool, which Lesson 56 covers.
Review: Section 5, The Kinds of Level You Will Meet
Question 5 · correct answer D
Take-profits sit at the number and stops just past it, different providers show slightly different prices, most charts draw only the bid, and traders aim for different prices. A band describes all of that and a line does not.
A is a matter of convenience, not the reason. C is fabricated. B invents a rule about timeframes that the lesson never states.
Review: Section 6, A Zone, Not a Line
Question 6 · correct answer B
For resistance, the top of the zone is the highest wick tip, 1.2755, and the bottom is the lowest of the closes, 1.2731. The zone is 24 pips wide.
A uses only the wick tips and C uses only the closes, so each leaves out half of where the turning took place. D mixes a close and a wick tip that are not the two extremes.
Review: Section 7, How to Mark a Level
Question 7 · correct answer A
A daily chart, turns weeks apart and a round number in the zone are three of the four things that point toward a major level. Each one means more traders can see it.
B and D describe minor levels, which show only on short charts with turns close together. C is wrong because when a level was drawn says nothing about how widely it is watched.
Review: Section 8, Major and Minor Levels
Question 8 · correct answer C
The closing convention counts a break only when the candle closes past the far edge of the zone. This one closed at 149.36, below the zone, so the level did not break.
A applies the other convention, where any trade beyond the zone counts. B and D describe what can happen after a level has broken, and by this convention it has not.
Review: Section 9, What Counts as a Break
Question 9 · correct answer D
Price returning to a broken level is a retest, and the old resistance holding as support is role reversal.
A would mean price fell back through the level, which it did not. C describes a jump between prices, not a return to a level. B overstates it; a single retest proves nothing about the whole trend.
Review: Section 10, When a Level Breaks, It Can Switch Sides
Question 10 · correct answer B
On a finished chart your eye finds the lines that worked, and the levels that failed never look like levels, so they never get drawn. Marking a level before price arrives is the only honest test.
A is not true and would not explain the effect anyway. C describes something charts do not do. D is unsupported, and the problem is in how the chart is read, not in the market that produced it.
Review: Section 12, What a Level Tells You, and What It Does Not
Keep going
Reading Price Structure is written by Kanin D. Alldredge for The Currency Classroom, and it is free to read. There is more free from CNS: start here.
Start free with CNS →